
 By Neng Nana
In the rapidly evolving landscape of digital marketing, the ability to translate social media activity into tangible business outcomes is no longer just a skill—it is a survival requirement. As we head into 2026, where revenue growth remains the primary mandate for CMOs, the era of "vanity metrics" is officially over. Today, social media managers are expected to act as data analysts, bridging the gap between creative content and the bottom line.
Whether you are aiming to refine your brand awareness, optimize ad spend, or improve customer experience, understanding the 25 essential social media metrics is the first step toward strategic mastery.

The Strategic Foundation: Metrics vs. KPIs
To succeed in 2026, one must first distinguish between a metric and a KPI (Key Performance Indicator). A metric is a raw data point—it tells you what happened. For instance, knowing that a video received 5,000 impressions is a metric. A KPI, however, is a strategic objective. If your goal is to "increase qualified leads from Instagram by 15% this quarter," that is a KPI. You use the metric (impressions) to inform the progress toward the KPI (leads).
Effective strategy often hinges on the 70/20/10 rule: 70% of your content should provide intrinsic value, 20% should involve community-shared or curated content, and 10% should be strictly promotional. By balancing your content, you can better assign which metrics to track for which specific campaign goals.

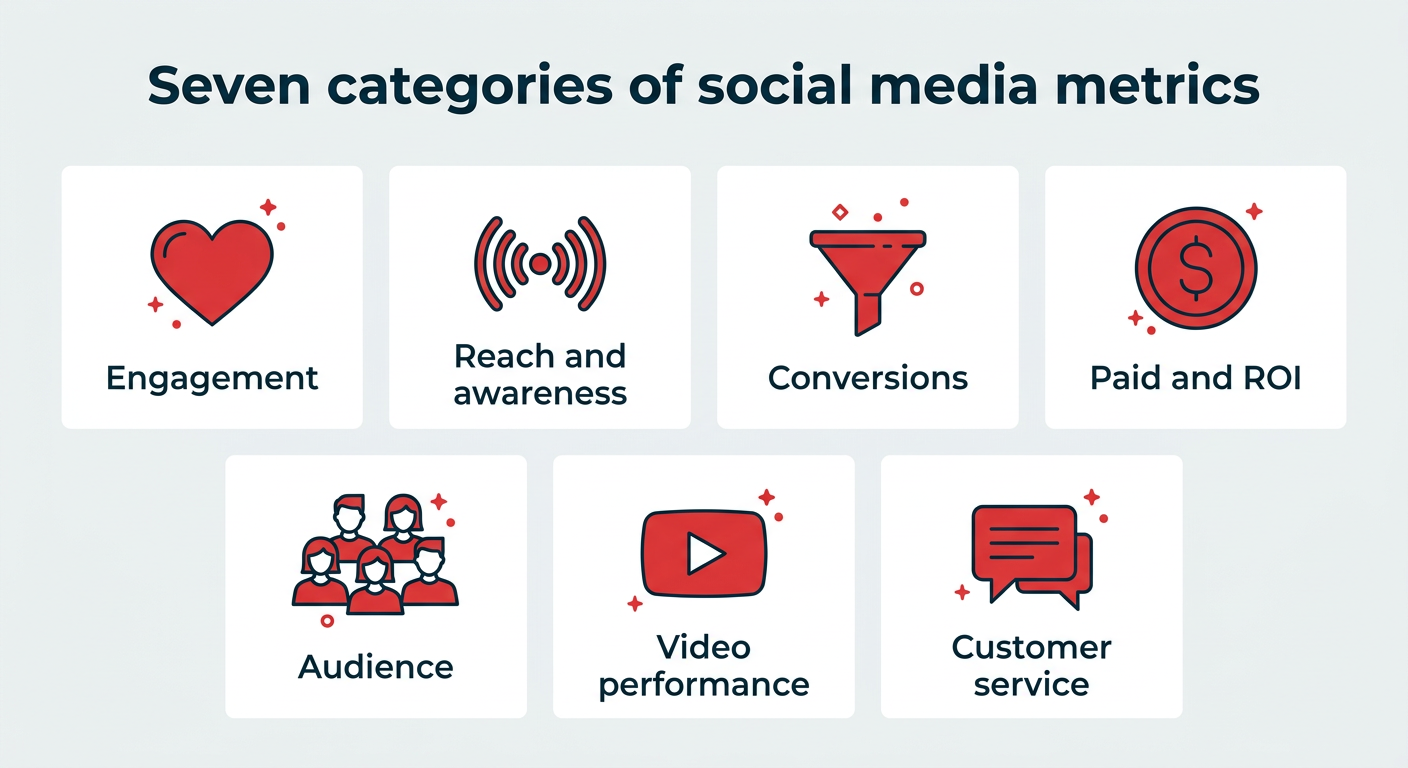
The 2026 Metric Landscape: A Categorized Deep Dive
1. Engagement Metrics: The Pulse of Resonance
Engagement is the most reliable indicator of whether your content is truly connecting.
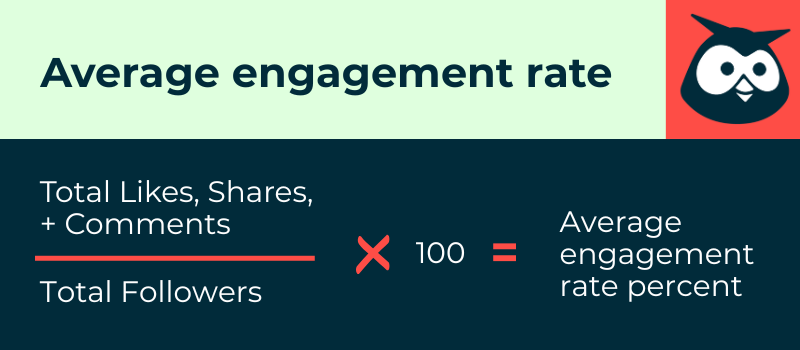
- Engagement Rate: This measures resonance relative to your audience size. The standard formula—(Likes + Comments + Shares + Saves) ÷ Total Followers × 100—remains the gold standard.
- Saves and Save Rate: In 2026, saves represent high-intent engagement. When a user bookmarks your tutorial or product roundup, they are signaling that your content holds long-term value.
- Comments: Beyond simple reactions, comments serve as a feedback loop, providing qualitative data on audience sentiment and unmet needs.
2. Reach and Awareness: Measuring Brand Visibility
Before you can convert, you must be seen.
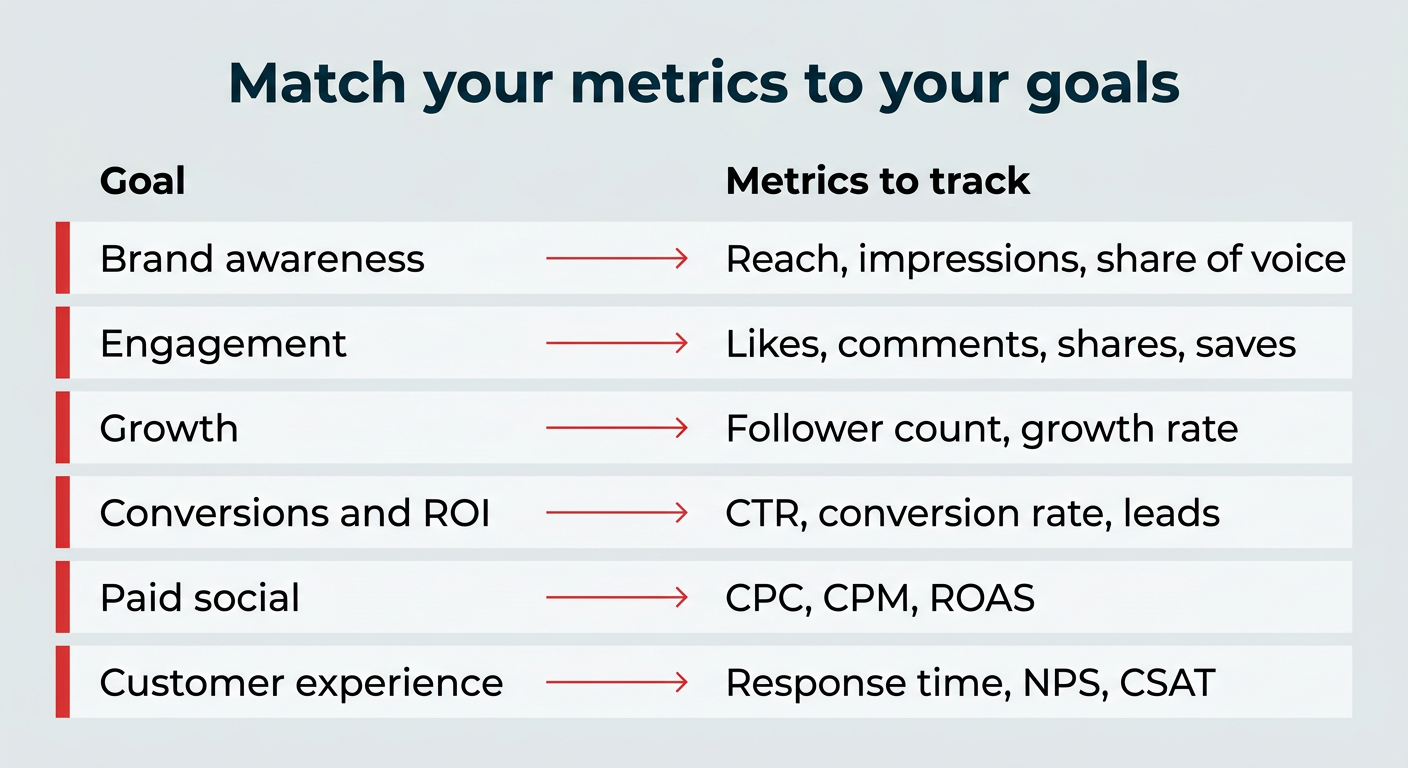
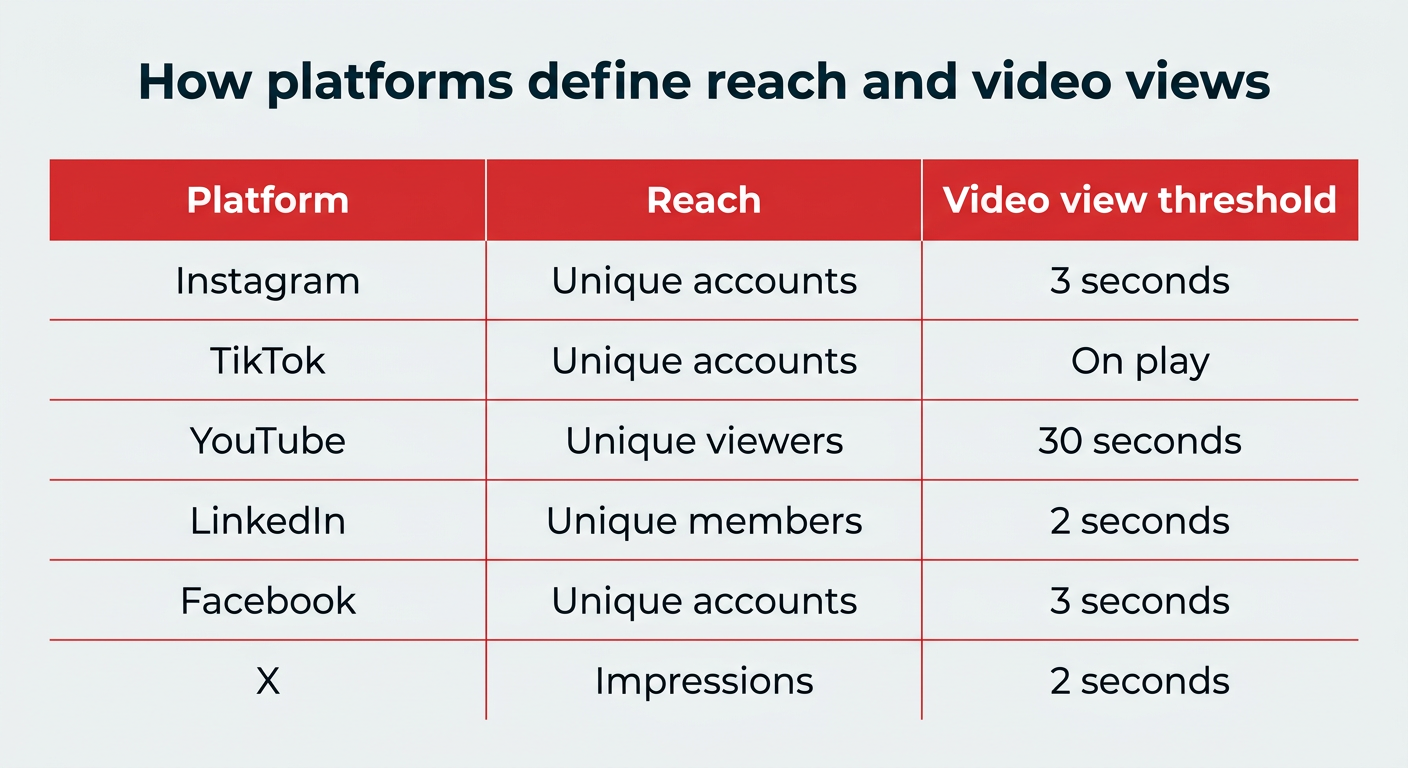
- Reach vs. Impressions: Reach measures unique accounts, while impressions count total views. A high impression-to-reach ratio suggests "sticky" content that users return to multiple times.
- Social Share of Voice (SSoV): This measures your brand’s visibility compared to competitors. By calculating your brand mentions against the total industry volume, you can benchmark your market relevance.
- Social Search Visibility: As Gen Z increasingly uses TikTok and Instagram as primary search engines, tracking where your brand ranks for specific keywords within these apps has become a non-negotiable part of the SEO landscape.
3. Conversion and ROI: Proving Business Impact
With third-party cookies largely phased out, attribution has become more challenging. The use of UTM parameters is essential to track a user’s journey from a social post to your website.
- Conversion Rate: The percentage of users who move from a social click to a business goal, such as a sign-up or purchase.
- CTR (Click-Through Rate): A vital indicator of how compelling your Call-to-Action (CTA) is.
- ROAS (Return on Ad Spend): The ultimate metric for leadership. ROAS tells you exactly how much revenue is generated for every dollar invested in social advertising.
4. Audience and Sentiment: Understanding the "Who"
Understanding your audience goes beyond demographics. In 2026, sentiment analysis—using AI to categorize the emotional tone of brand mentions—is essential to protect brand reputation and refine messaging.
- Follower Growth Rate: Rather than just tracking total followers, measure growth as a percentage of your total audience to understand momentum.
- Demographics: Leverage psychographic data to align your posting schedule and content themes with the specific behaviors of your core demographic.
5. Video Performance: The Engagement Driver
With short-form video dominating, video metrics have become more nuanced.
- Completion Rate: A high completion rate is a stronger indicator of quality than a simple view count. It signals to platform algorithms that your content is worth promoting to a wider audience.
- Watch Time: Tracking where viewers drop off is crucial for editing future content to maintain higher retention.
6. Customer Service Metrics: Building Loyalty
Social media is the new customer service desk.
- Average Response Time: Speed is currency in 2026. AI-driven chatbots are now standard, but the speed of human-to-human resolution remains a critical differentiator.
- CSAT and NPS: These scores measure satisfaction and loyalty, respectively. They serve as leading indicators of long-term customer retention.
Implications: Turning Data into Decisions
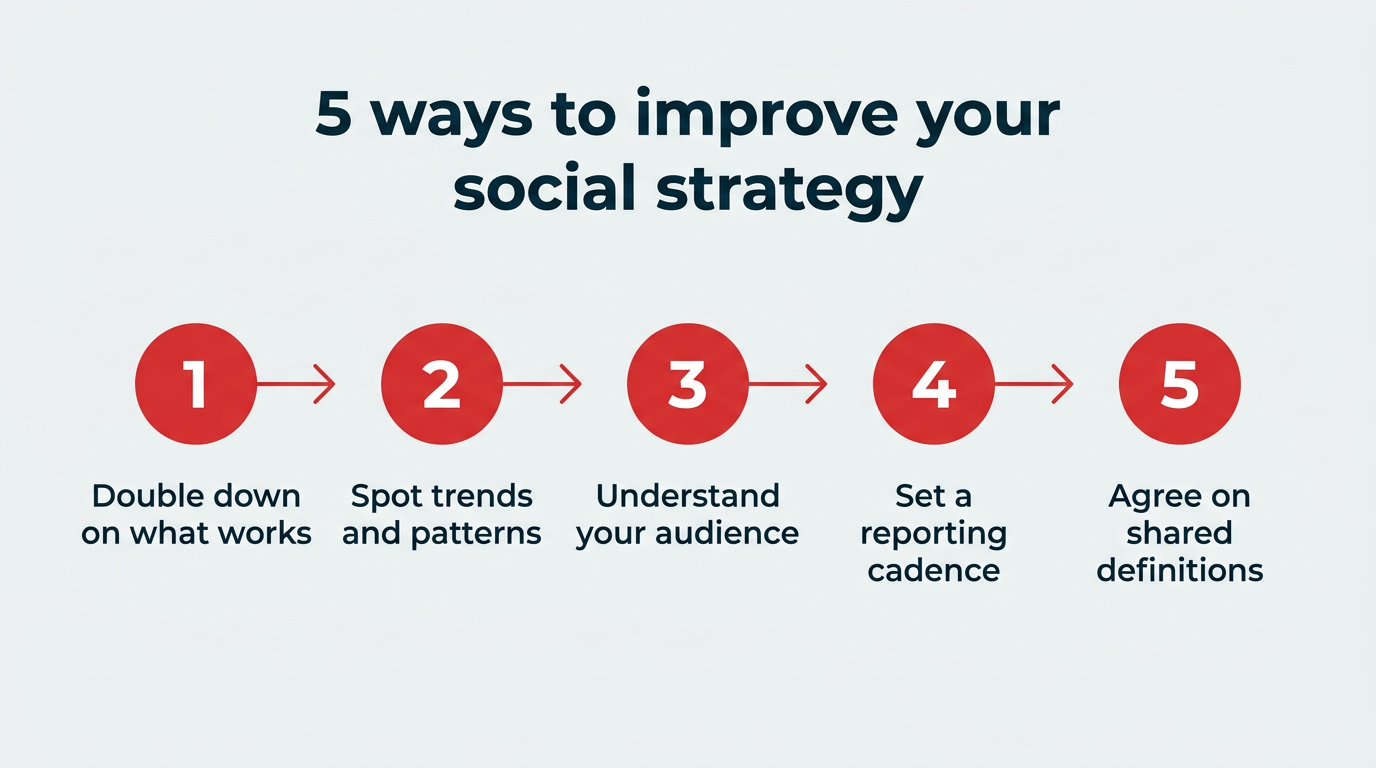
Measurement is useless without a feedback loop. Once you have gathered your data, you must translate it into action:
- Identify High-Performers: Replicate the themes and formats of your top-performing posts.
- Audit the Bottom: If a specific content type consistently fails, consider pivoting or removing it from your rotation.
- Benchmark Against Competitors: Use tools to track SSoV and sentiment to ensure you aren’t falling behind industry standards.
- Align with Sales: Ensure your social metrics are mapped to revenue data to prove your department’s ROI to stakeholders.
- Iterate: Use your monthly report as a launchpad for the next month’s creative experiments.
Platform Nuances: Why Definitions Matter
A major pitfall for social media managers is comparing "apples to oranges." Platform definitions vary significantly:
- Instagram/Facebook: Define reach as unique accounts and views as at least 3 seconds.
- YouTube: Views are counted after 30 seconds.
- TikTok: Views are counted almost instantly.
- LinkedIn: Views require 2 seconds of watch time with 50% of the video in view.
Always check the native platform definition before creating a master spreadsheet. Comparing raw numbers across different platforms without normalizing for these definitions will lead to skewed results and poor strategic decisions.
Tools of the Trade
For smaller businesses, Meta Business Suite and native platform analytics provide a solid baseline. However, as your operations scale, you will likely require a unified dashboard. Tools like Hootsuite, Perch, and Lumen by Talkwalker are designed to aggregate data from multiple channels into a single view, allowing you to track sentiment, mentions, and ROI across the entire social web.
Summary: The Path Forward
In 2026, your social media strategy should not be static. It should be a living, breathing experiment powered by data. By focusing on the metrics that directly impact your specific goals—whether that is brand awareness or revenue generation—you can move away from chasing likes and start driving real, measurable success. Remember, the best strategy is one that uses today’s data to predict tomorrow’s trends. Stay consistent, stay analytical, and keep your focus on the metrics that actually move the needle.
 Reynand Wu
  Muslim
  Nila Kartika Wati