
 By Ammar Sabilarrohman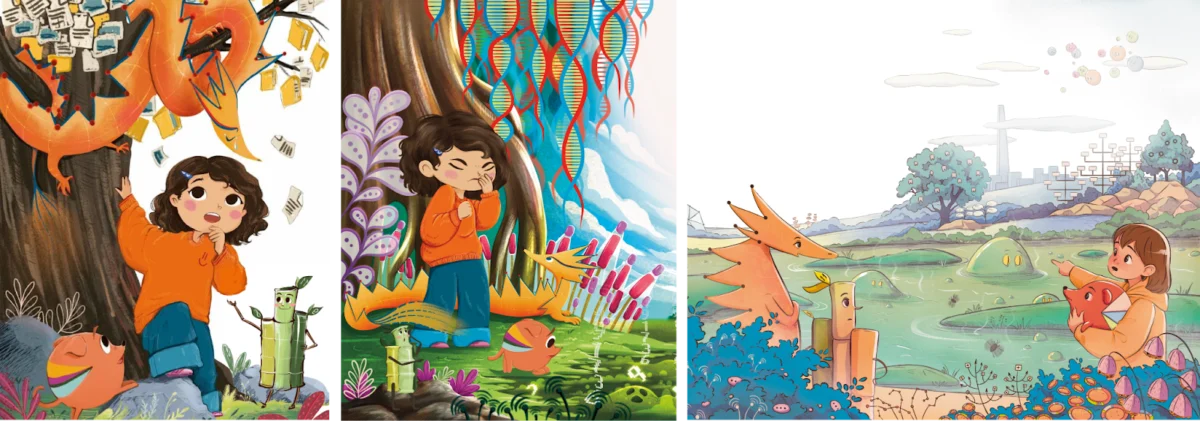
“Daddy, what’s your job?”
It is a question every parent in a specialized field eventually faces, usually followed by the blank stare that occurs when one tries to explain the intricacies of business intelligence or data architecture to a six-year-old. For Alex Kolokolov and Natalia Kiseleva, two prominent figures in the world of data visualization, that question wasn’t just a hurdle—it was a catalyst.

They wanted to bridge the gap between their complex, logic-driven professional lives and the imaginative world of their children. What began as a personal mission to explain “pretty pictures” on a screen has blossomed into Data2Kids, a comprehensive initiative that aims to teach children the fundamental language of the 21st century: data literacy.
The Genesis of an Idea: Bridging the Generational Gap
For data professionals, the field is a blend of artistry and technical rigor—a space where sleek designs meet profound logical challenges. However, communicating the value of this field to a child is notoriously difficult.

“We wanted to find a bright and engaging way to talk to our children about what we do for work,” explains Kolokolov. “Even if they don’t follow in our footsteps, we wanted them to respect and appreciate the passion we have for our craft.”
The authors recognized that in an increasingly data-saturated world, the ability to interpret, clean, and visualize information is no longer just a professional skill—it is a survival skill. By introducing these concepts early, they aimed to equip the next generation with the cognitive tools necessary to navigate an uncertain future. This realization shifted the focus of their project from a simple bedtime story to a pedagogical tool.

Chronology of a Creative Endeavor
The development of the book, Christine and the Magic Charts, followed a rigorous, multi-year creative path.
Phase 1: Character Development (Early 2024)
Natalia Kiseleva, leveraging her background as a data artist and comic creator, began sketching. They moved away from literal representations of "data people," opting instead for cute, anthropomorphized monsters. This choice was deliberate: by giving individual personality traits to different chart types, the authors made complex abstract concepts relatable. The protagonist, Christine, was modeled after Kiseleva’s daughter, Maya, creating an immediate emotional anchor for the narrative.

Phase 2: The Pie Chart Dilemma
One of the most innovative aspects of the book is the characterization of "Piechi," the pie chart monster. In the data science community, the pie chart is often viewed with professional skepticism—or even disdain—due to its potential for misuse. The authors leaned into this irony. “Natalia imagined Piechi as a dog that needs to be trained not to overeat,” Kolokolov notes. This metaphor serves as a brilliant, accessible lesson on data integrity and the responsible use of visualization tools.
Phase 3: The Narrative Arc
Alex Kolokolov, leveraging his experience as an author of three books on business intelligence, structured the plot around a classic "hero’s journey." Christine travels into a mysterious, abstract world of data to rescue her father, who has gone missing within the "Data Tower." Along the way, she meets various chart-monsters, each with unique "diets" and personalities, who teach her how to use them effectively.

Phase 4: Scaling the Vision (2025–2026)
Recognizing that the scope of the project exceeded their initial capacity, the duo brought in professional illustrator Anastasiya Lykova. Her soft, expressive style brought the "Data World" to life. By early 2026, the project had evolved beyond the book into a full-fledged ecosystem under the Data2Kids banner.
Supporting Data and Educational Frameworks
The success of Data2Kids is not just anecdotal; it reflects a growing global push for data literacy in primary education. According to the authors, the project functions on three distinct pillars:

- The Storybook: A narrative-driven introduction to the logic of visualization.
- The Workbook: An interactive component featuring tasks that require children to collect real-world data—such as tracking daily habits or weather patterns—and turn them into charts.
- The Community: A local and international network of "data-parents" who use these materials to facilitate shared learning sessions.
The effectiveness of this approach lies in its "learn-by-doing" methodology. By turning the daunting task of "data analysis" into a game of "collecting and drawing," the authors lower the barrier to entry for young learners. The Data2Kids website now serves as a repository for these educational materials, including free resources that allow teachers and parents to replicate the methodology in their own homes or classrooms.
Official Perspectives: The Value of Early Literacy
The initiative has garnered attention for its unique blend of professional-grade data ethics and children’s literature. When asked about the importance of such projects, experts in the field of education often point to the "Black Box" problem: as AI and algorithmic decision-making become more pervasive, the ability to visualize the underlying data becomes a shield against misinformation.

"By teaching children that a chart has a personality—and that some charts, like the pie chart, have specific ‘diets’ or limitations—we are teaching them to be critical consumers of information," Kiseleva explains.
The authors also highlight that the Data2Kids project is not merely about creating the next generation of data scientists. It is about fostering a society that is comfortable with ambiguity and skilled in the art of storytelling through evidence.

Implications for the Future: The Global Competition
The culmination of this work is the Data Kids! international competition. This initiative invites children from across the globe to submit their own data visualization projects. By providing a stage for children to showcase their work, the authors are moving the needle from passive consumption of educational media to active participation in a global community.
The competition, which features categories based on age and data complexity, has already seen submissions ranging from hand-drawn charts about favorite toys to digital dashboards tracking local biodiversity.

For parents and educators, the implications are clear: the divide between "technical work" and "creative play" is shrinking. As Kolokolov and Kiseleva have demonstrated, when you provide children with the right language, they are more than capable of mapping the complexities of the modern world.
Conclusion: A Legacy of Curiosity
The Data2Kids project serves as a poignant reminder that even the most technical professions are rooted in human curiosity. Through Christine and the Magic Charts, Kolokolov and Kiseleva have managed to transform the cold, hard logic of data into a warm, inviting landscape for children to explore.

As they continue to develop new workbooks and expand their international community, the authors remain focused on their primary goal: capturing the magical moment when a child stops seeing the world as a series of unrelated events and starts seeing it as a story told through data.
For those looking to join the movement, the message is simple: you don’t need a degree in statistics to start the conversation. You just need a story, a few charts, and the willingness to let your child lead the way into the Data Tower.

About the Authors
Alex Kolokolov is a veteran of the business intelligence industry with over 15 years of experience. As the founder of Data2Speak Inc. and the author of three seminal books on dashboard design and BI strategy, he is a leading voice in the professional dataviz community.
Natalia Kiseleva is an engineer, BI analyst, and educator at the Higher School of Economics and Moscow State University. Her work focuses on the intersection of data visualization and art, aiming to popularize the field through accessible comics and interactive design.

For more information on the project or to purchase the book, visit Data2Kids.com.
 Lina Irawan
  Nana
Nana  Nila Kartika Wati