
“Daddy, what’s your job?”
For many professionals in the high-stakes world of data analytics and business intelligence, this simple inquiry from a child is often met with a struggle to find the right words. How do you explain the abstract beauty of a trend line, the rigorous logic of a dataset, or the sleek architecture of a dashboard to a mind that is still learning the building blocks of the world?

For Alex Kolokolov and Natalia Kiseleva, two prominent figures in the data visualization (dataviz) community, this question sparked more than just a fleeting conversation. It became the catalyst for Data2Kids—a multifaceted project designed to translate the complex language of data into a narrative that children can not only understand but cherish. Their journey has culminated in the release of Christine and the Magic Charts, a children’s book that treats data literacy as a superpower.
The Genesis of an Idea: Bridging the Generational Gap
The core motivation behind Data2Kids was rooted in a desire to share professional passion with the next generation. As Kolokolov, a veteran of the business intelligence industry with 15 years of experience, notes, the goal was never to force children into a specific career path. Rather, it was about cultivating an appreciation for the logic and aesthetic potential inherent in data.

“Data visualization is amazing: it’s full of beauty and logic, sleek designs, a variety of charts, fascinating topics, and the chance to work with important data,” the authors explain. In an era where information literacy is becoming as essential as reading and writing, Kiseleva and Kolokolov identified a gap in early childhood education: the absence of accessible, creative materials that introduce children to the concept of data as a tool for storytelling.
Chronology of a Creative Endeavor
The project began as an ambitious thought experiment. Kiseleva, who brings experience in creating data-driven characters and comic-style storytelling, and Kolokolov, a seasoned author of professional technical books, began brainstorming how to pivot their expertise toward a younger audience.

Phase 1: Conceptualization and Character Design
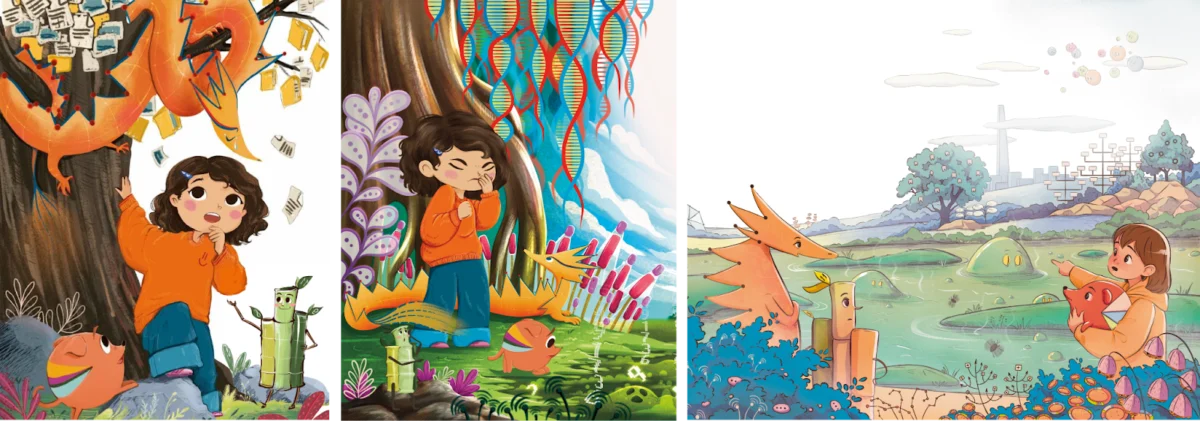
The character development process was highly iterative. To avoid the monotony of “diagram-like” people, Kiseleva opted for creatures that felt tangible and relatable. The protagonist, Christine, was modeled after Kiseleva’s own daughter, Maya—a character defined by curiosity and a love for bunnies.
The most significant creative breakthrough, however, was the invention of "Piechi," the pie chart character. Recognizing the dataviz community’s frequent, often humorous, skepticism toward pie charts, the authors decided to lean into the controversy. By framing Piechi as a “dog that needs to be trained not to overeat,” they turned a technical limitation into an engaging educational lesson on the proper use of visualization.

Phase 2: Plotting the Adventure
The narrative structure leans on the classic "hero’s journey." In Christine and the Magic Charts, the protagonist ventures into a mysterious, abstract world of data to rescue her father. Throughout her quest, she encounters various "chart characters"—each with unique personalities and, crucially, specific "diets" or rules that govern their effective use. This narrative device serves as an intuitive way to teach children that, like tools in a workshop, different charts are designed for different purposes.
Phase 3: The Search for a Visual Voice
While Kiseleva is an accomplished illustrator, the demands of book production—combined with professional obligations and parenting—necessitated external support. The search for an illustrator was a rigorous process, involving a review of diverse styles. They eventually selected Anastasiya Lykova, whose expressive, soft aesthetic resonated with the project’s vision. The collaboration ensured that the technical nuances of the charts remained clear while maintaining a whimsical, storybook quality.

Supporting Data: Why Early Literacy Matters
The Data2Kids initiative arrives at a pivotal moment in global education. According to recent trends in pedagogical research, children are increasingly exposed to visual data through digital interfaces and school curricula. However, formal training in "data empathy"—the ability to interpret data with context and skepticism—is largely absent in primary education.
The authors have backed their literary efforts with empirical engagement. Through their local community workshops and the testing of a dedicated workbook, they have gathered data on how children interact with these concepts. Their findings suggest that when children are taught to view a bar chart or a scatter plot as a "character" with a distinct purpose, their ability to retain information and apply it to their own "data collection" tasks increases significantly.

Official Perspectives: The Professional-Parent Hybrid
The authors bring significant institutional credibility to the project. Alex Kolokolov, founder of Data2Speak Inc., has authored three industry-standard books on dashboard design and is a primary organizer of international dataviz conferences. Natalia Kiseleva, a lecturer at Moscow State University and the Higher School of Economics, bridges the gap between academic rigor and creative communication.
Their combined "official" stance is that data literacy should not be treated as a cold, clinical skill. Instead, they argue that by humanizing data, we prepare the next generation to navigate an increasingly complex, algorithm-driven world with confidence and curiosity.

Implications: Building a Global Community
The impact of Data2Kids is currently expanding beyond the pages of the book. The initiative has evolved into:
- The Data2Kids Website: A hub for educational resources, where the story of the chart characters serves as a gateway to broader data literacy.
- The Data Kids! Competition: An international contest designed to encourage children to create their own visualizations, demonstrating their understanding of the principles introduced in the book.
- The Workbook Project: A hands-on, activity-based supplement that guides children through the process of collecting data, selecting the right visualization, and "feeding" their chart characters correctly.
This, the authors hope, is just the beginning. By creating a themed workbook where characters act as guides, they are fostering a "learn-by-doing" environment. The project aims to establish a global community of "data-parents" who prioritize these skills as a foundation for their children’s future.

Conclusion: A New Language for a New Generation
The success of Christine and the Magic Charts highlights a shift in how we perceive professional expertise. Rather than siloing our skills within the walls of corporate offices and academic journals, there is a growing trend toward democratization—taking the "magic" of our work and translating it for the people who matter most.
As Kiseleva and Kolokolov look toward the spring and the launch of further activities, the message remains clear: the world of data is not just for the analysts and the engineers. It is a playground of logic and creativity, and with the right story, it is a language that even the youngest among us can learn to speak fluently.

For parents in the data industry, the question "What is your job?" is no longer a hurdle. It is an invitation to begin a journey—one that transforms a complex profession into a shared adventure.
For those interested in exploring the world of Data2Kids or joining the upcoming international competition, visit the project’s official portal.
