

By: Editorial Staff
Date: June 19, 2026
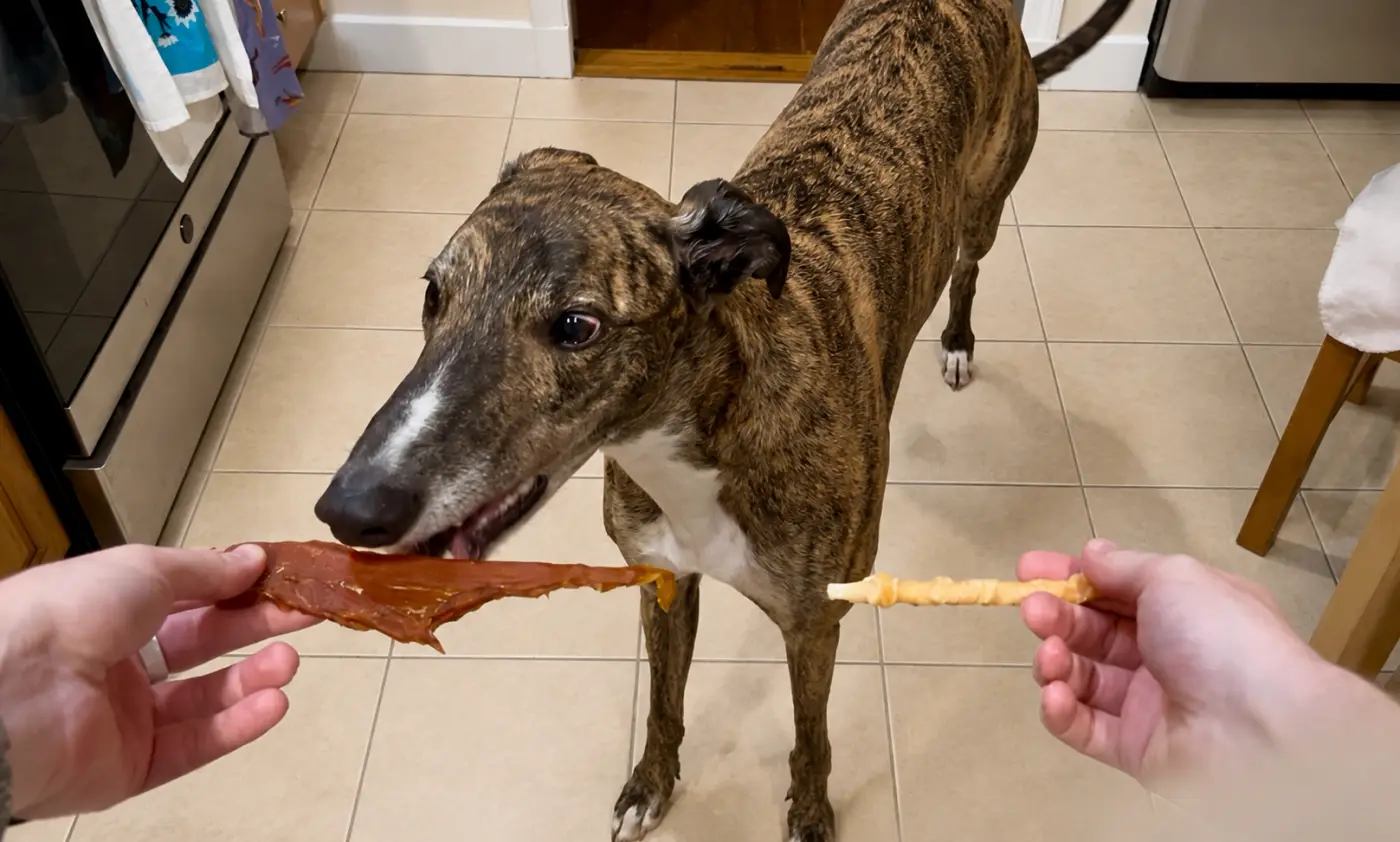
For pet owners, the bond with a canine companion is often defined by the quiet rituals of daily life: the morning walk, the evening cuddle, and the offering of a snack. Yet, for Adam Wespiser, a data-driven pet parent to Bebop—a towering, 83-pound, 33-inch-tall Greyhound—the standard experience of treat-giving was shrouded in a persistent, nagging mystery. Despite years of observing Bebop’s enthusiastic consumption of everything from illicit pizza crusts to stray cat food, Wespiser realized he lacked a definitive answer to the fundamental question: What is Bebop’s absolute favorite snack?
The inability to simply ask his companion led Wespiser down a rigorous path of inquiry. Moving beyond casual observation, he applied the principles of statistical modeling to his kitchen, turning a daily chore into a controlled scientific experiment.

The Mathematical Framework: Bradley-Terry and Elo
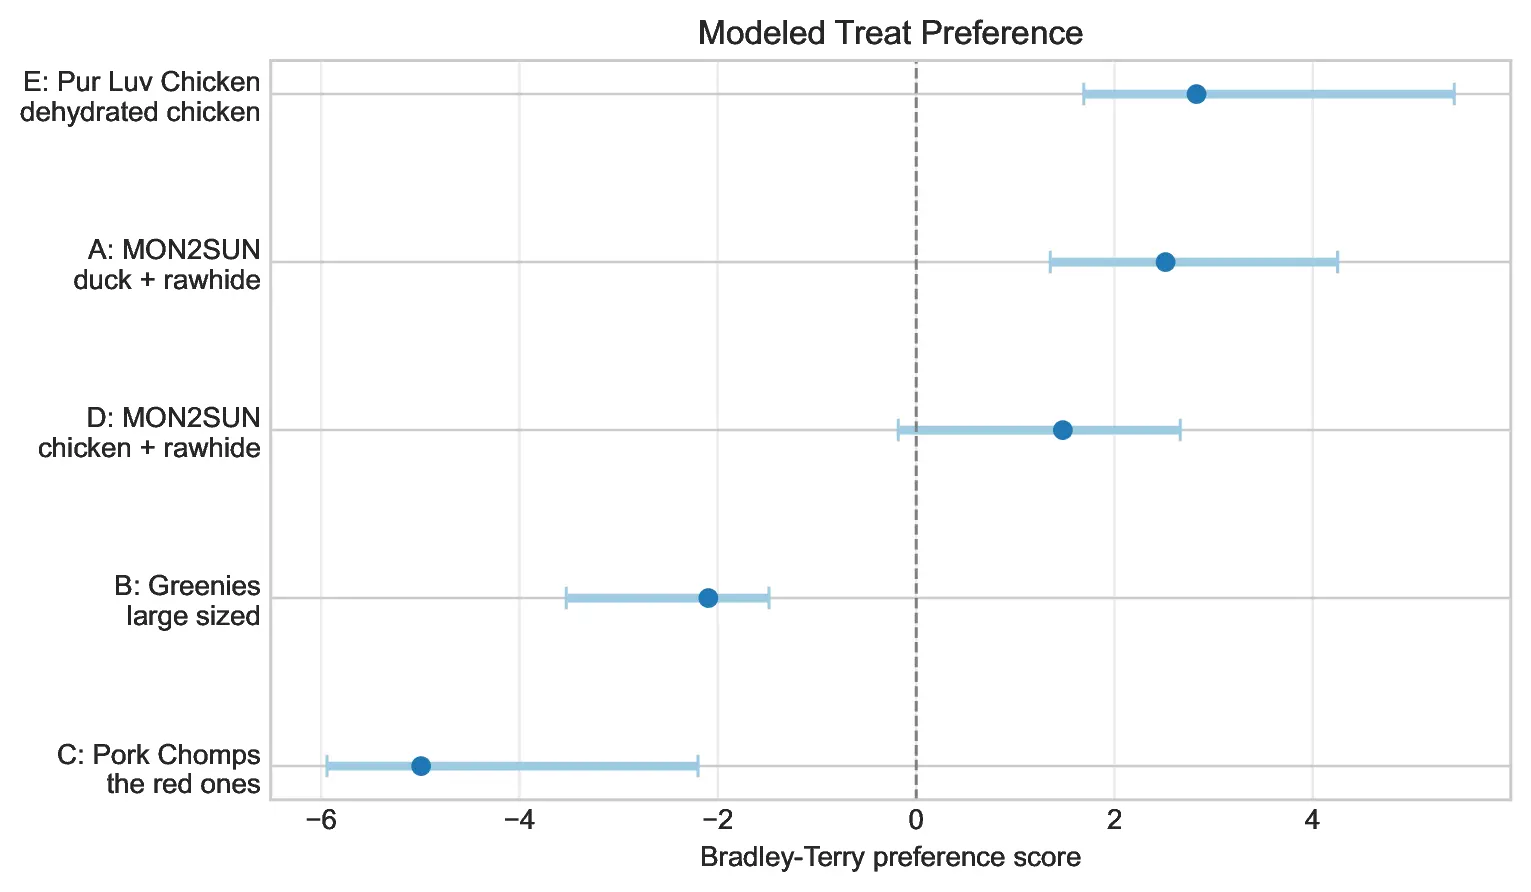
At the heart of Wespiser’s investigation lies the Bradley-Terry model, a sophisticated mathematical framework used to predict the outcomes of pairwise comparisons. Originally developed for sports and gaming, the model assigns a "strength" score ($p_i$) to each competitor. By calculating the ratio of a specific treat’s strength to the sum of the strengths of two competing treats, the model provides the probability of one "beating" the other.
This approach is mathematically synonymous with the log-odds of a result, a concept closely related to the Elo rating system—the industry standard for chess rankings. Unlike static systems, the Elo system is an "online" algorithm; it updates ratings incrementally after every match. While Wespiser opted for the Bradley-Terry model due to his smaller, finite dataset, the logic remains the same: treat selection is not a matter of random chance, but a quantifiable expression of preference.
This methodology is not merely a hobbyist’s curiosity. It is the same foundational logic that propelled Mark Zuckerberg’s early "FaceMash" experiment into the cultural zeitgeist and powers the modern-day "Chatbot Arena," where artificial intelligence models compete for supremacy. By applying these high-level statistical tools to the humble dog treat, Wespiser has successfully elevated canine nutrition to the realm of rigorous analytics.

Chronology of the Experiment
The experiment was conducted with clinical precision. Every night at approximately 11:00 PM, Wespiser initiated the "Choice Protocol." After training Bebop to recognize the command "choice," Wespiser would present two different treats, one in each hand. Bebop was then required to make a selection, with the unchosen treat returned to the bag.
Phase I: Establishing the Baseline
Initially, the experiment utilized a diverse selection of treats, ranging from long-standing staples like Greenies to various options sourced via online retailers. Wespiser intentionally avoided controlling for size or weight, arguing that the experiment needed to reflect real-world, post-dinner feeding habits. While acknowledging that this might introduce a "size bias," he maintained that the consistency of the trial conditions was more critical than normalizing for caloric density.
Phase II: The Refinement of Trials
Midway through the study, the data began to clarify. It became evident that specific treats, namely the "Pork Chomps" and Greenies, were consistently failing to capture Bebop’s interest. With these candidates statistically eliminated from the top tier, Wespiser pivoted his strategy. He curtailed the trials involving the underperforming treats and concentrated his efforts on the high-performing contenders, thereby increasing the statistical power of the results for the remaining candidates.
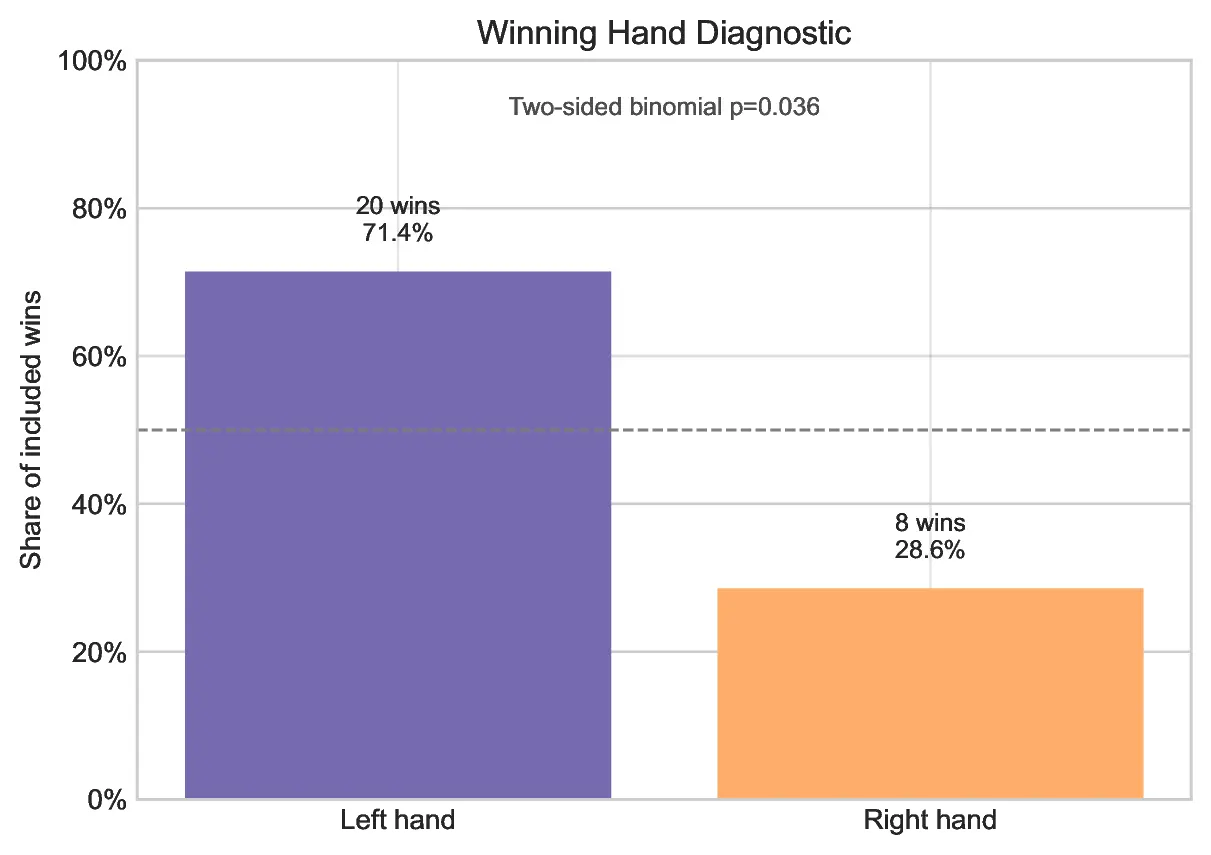
Phase III: Identifying the "Right-Side" Bias
An unexpected variable emerged during the analysis: a measurable, persistent preference for the treat presented in Wespiser’s left hand (Bebop’s right side). While the data suggests a clear directional bias, Wespiser was careful to avoid anthropomorphizing the result. The preference may be due to environmental factors, such as the proximity of a window fan on the left side of the kitchen, rather than an inherent, neurological "right-pawedness" in the Greyhound.
Supporting Data and Statistical Findings
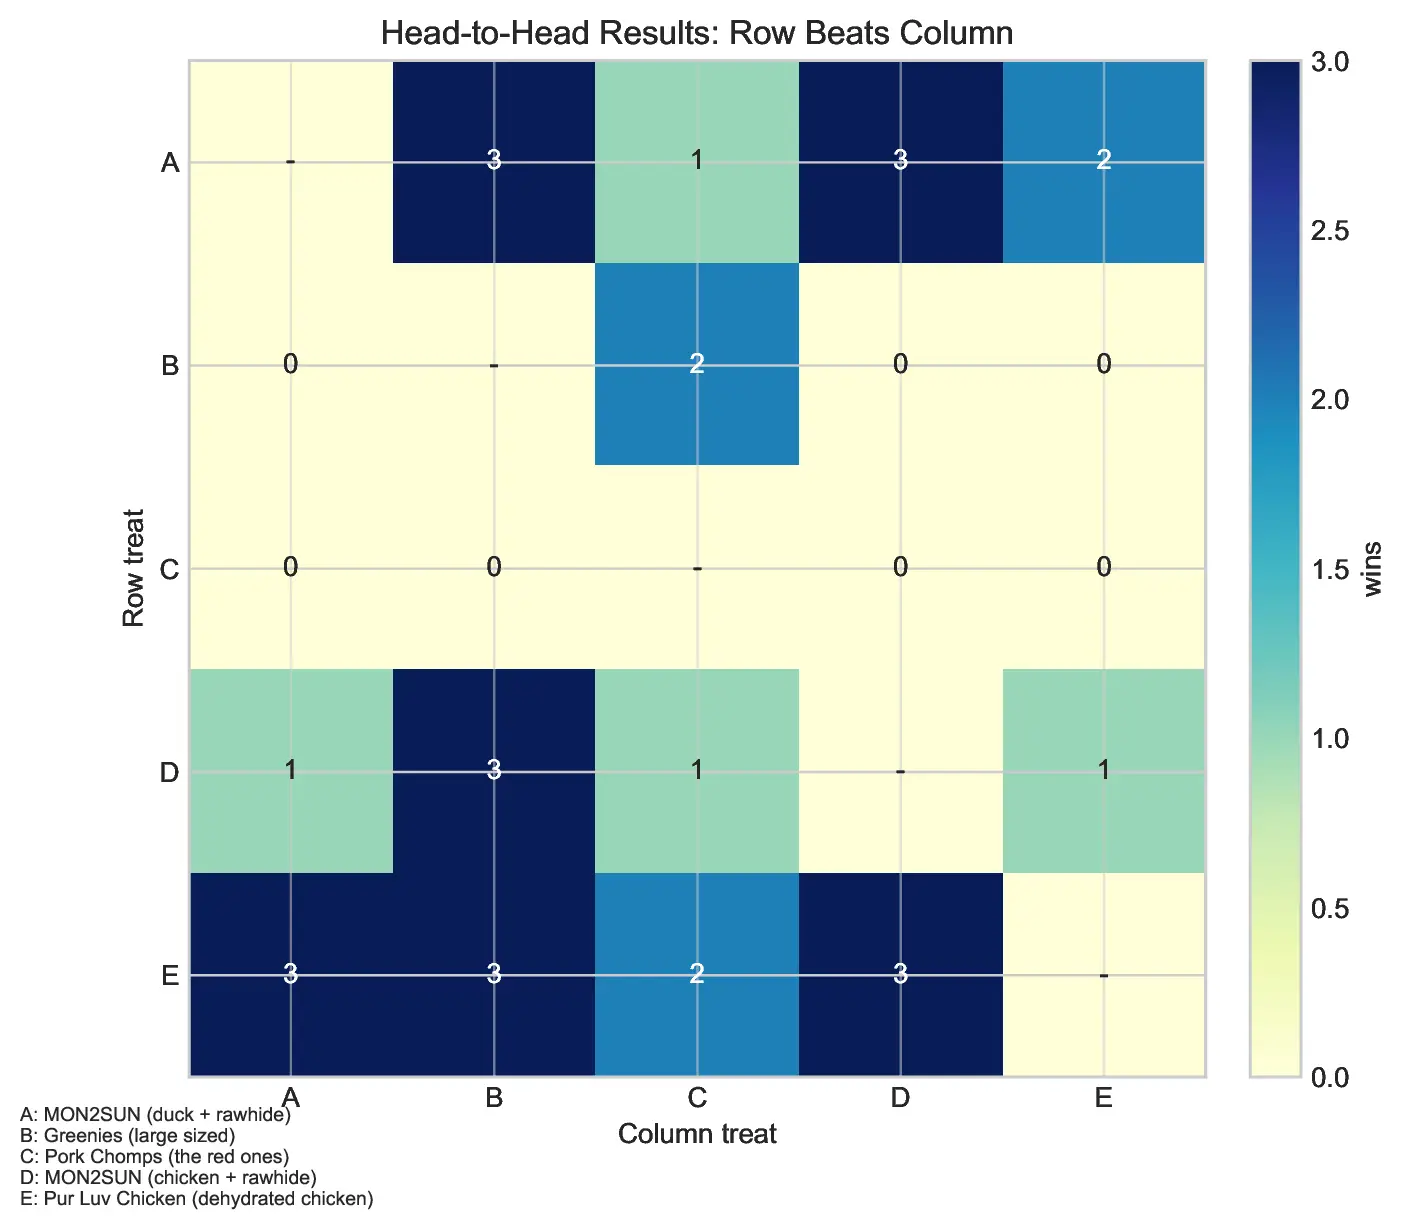
The results of the trials were distilled into a series of heatmaps and probability distributions. By performing a bootstrap analysis—repeatedly resampling his data and re-fitting the Bradley-Terry model—Wespiser achieved a high level of confidence in his findings.
- The Champion: Treat E, identified as "Pur Luv Chicken," emerged as the clear leader. It secured the top spot in 63% of the bootstrap iterations.
- The Contender: Treat A, the runner-up, remains a viable challenger, capturing the top spot in 33% of iterations. The current head-to-head record between E and A stands at 3–2, suggesting that the difference in preference is narrow.
- The Underperformers: Treats B and C were statistically relegated to the bottom of the rankings, showing no significant evidence of being "favorites."
The model indicates a 57.5% probability that the "Pur Luv Chicken" will defeat the primary contender in a direct match-up. While the crown currently belongs to the dried chicken, the statistical margin is slim enough that the experiment remains ongoing.
Official Observations: The Subject’s Perspective
While Bebop cannot provide a written report on his satisfaction, his commitment to the "scientific process" has been unwavering. Wespiser notes that the Greyhound remains highly enthusiastic about the nightly trials, sniffing both options with methodical care before making his selection. This consistency in behavior is vital for the integrity of the experiment, ensuring that the results are not the product of distracted or disinterested grazing.
The inclusion of the "Choice" command proved essential, as it transformed a chaotic, instinct-driven feeding moment into a deliberate cognitive exercise. The Greyhound’s adherence to this routine suggests that, at least in the context of snack time, the subject is a willing participant in the data-gathering process.
Implications and Future Directions
The implications of this experiment extend beyond the kitchen of one Greyhound owner. Wespiser’s work highlights a growing trend in "data-literate pet parenting," where owners use technology and statistical modeling to better understand their animals’ preferences, health, and psychological motivations.
Practical Applications for Pet Owners
For the average consumer, this experiment serves as a template for product testing. Rather than relying on marketing claims or generic advice, pet owners can use pairwise comparisons to determine which supplements, foods, or treats provide the most value for their specific animal. By removing the guesswork, owners can reduce waste and ensure their pets are receiving the highest level of satisfaction.
The Future of the "Best Treat" Study
Wespiser intends to continue the trials, with a specific focus on the A vs. E showdown. By increasing the sample size for these two specific treats, he aims to achieve a higher degree of statistical significance, potentially narrowing the margin of error to a point where a definitive "winner" can be declared with absolute certainty.
Furthermore, this experiment poses interesting questions about environmental variables in pet research. If a simple window fan can influence a dog’s choice, how many other subtle, overlooked factors—scent, lighting, the speed of the presenter’s hand movement—influence the daily lives of our pets?
Ultimately, Wespiser’s experiment is a testament to the curiosity that defines the human-canine bond. By applying the rigor of the Bradley-Terry model to a simple bag of treats, he has not only found a way to quantify his pet’s preferences but has also deepened the communicative bridge between himself and Bebop. As the trials continue, one thing remains clear: in the pursuit of the perfect snack, the data doesn’t lie, and for a hungry Greyhound, the results are as delicious as they are statistically sound.
Source Code and Documentation
For readers interested in replicating this methodology or analyzing the raw data, the complete project, including the bootstrap analysis scripts and historical trial notes, is available via Wespiser’s GitHub repository.
