
 By Nana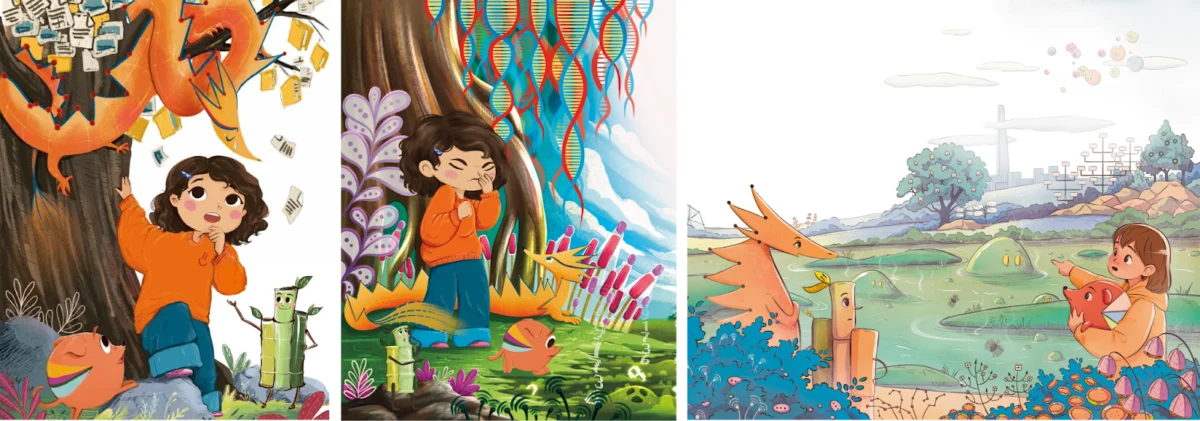
“Daddy, what’s your job?”
For many parents working in the high-stakes, abstract world of data analytics, this simple, innocent question often leads to a complex struggle. How do you explain the intricacies of business intelligence, the nuance of dashboard design, or the silent, invisible power of data to a child?

For Alex Kolokolov and Natalia Kiseleva, this wasn’t just a hurdle—it was an inspiration. As seasoned professionals in the data visualization (dataviz) field, the duo embarked on a mission to translate the logic, beauty, and utility of their work into a language children could understand. The result is not just a children’s book, Christine and the Magic Charts, but the birth of an entire ecosystem known as "Data2Kids."
The Genesis of an Idea: Making the Invisible Visible
The professional landscape of data visualization is often defined by KPIs, stakeholder requirements, and the rigid pursuit of actionable insights. Yet, at its core, dataviz is an exercise in storytelling. Recognizing this, Kolokolov and Kiseleva identified a unique opportunity to foster a new generation of data-literate individuals.

"Anyone who loves their job has probably wanted to share it with their kids," the authors note. "Even if they don’t follow in our footsteps, we wanted them to at least respect and appreciate what their parents are passionate about."
The duo recognized that in a rapidly changing, data-driven world, the ability to interpret information is a vital life skill. By introducing concepts like data collection and visual representation early, they hope to equip children with the tools necessary to navigate an increasingly complex information landscape.

Chronology: From Concept to Character
The project began as a creative experiment. Natalia Kiseleva, who brought her experience in creating data-themed characters and visual storytelling, teamed up with Alex Kolokolov, a veteran of technical writing and BI strategy.
1. Developing the Protagonists
The character development process was rooted in personal experience. The central figure, Christine, was modeled after Kiseleva’s daughter, Maya. Initially conceived as a human character, the authors quickly realized that to make the abstract world of data engaging, they needed a cast of creatures.

"We decided it would be better to make them cute monsters," Kiseleva explains. "It’s easier for children to distinguish between creatures than to keep track of a crowd of generic humans."
2. The Rise of "Piechi"
Perhaps the most significant breakthrough in the book’s development was the creation of Piechi, a character representing the humble—and often controversial—pie chart. Within the professional dataviz community, the pie chart is frequently viewed with skepticism due to its potential for misuse. However, Kiseleva saw a teaching moment. She reimagined Piechi as a pet that needs to be "trained" not to overeat, a clever metaphor for the importance of keeping pie charts simple and focused.

3. Plotting the Adventure
With the characters established, Alex Kolokolov took the lead on the narrative arc. They chose a classic "hero’s journey" structure: a young girl travels into a mysterious world of data to rescue her father. Along the way, Christine encounters various chart-characters, each with unique personalities and "dietary" needs—a playful way of explaining the specific use cases for different data visualization formats.
The Professional Collaboration: Finding the Right Voice
The transition from a concept to a published book required professional illustration. The authors sought a partner who could balance technical accuracy with a whimsical, child-friendly aesthetic. After reviewing portfolios from various artists, they selected Anastasiya Lykova.

Lykova, a parent herself, understood the importance of the emotional resonance the authors were striving for. The collaboration resulted in a visual style that is soft, expressive, and accessible, ensuring that the complex, dry world of data felt inviting to young readers.
Supporting Data: Why Early Literacy Matters
The "Data2Kids" initiative is backed by the growing belief that data literacy is the "new literacy." Research in educational psychology suggests that children are capable of understanding abstract concepts when they are framed through concrete, relatable narratives.

By treating data as a "magic world" and charts as "friends," the project leverages gamification to remove the fear often associated with mathematics and analytics. The authors have even developed a "chart chooser" and profiles for each character at the end of the book, transforming the narrative into a reference guide for young learners.
Official Perspectives: The Educational Shift
In the broader context of STEM education, the approach taken by Kolokolov and Kiseleva represents a significant shift. Educators are increasingly looking for ways to integrate data ethics and literacy into primary education.

"We want to create shared, precious memories," the authors stated. By building a community around the book, including a local group of "data-parents" and children, they are effectively turning the project into a social learning experience. The "Data2Kids" website now serves as a hub for educational materials, competitions, and collaborative exercises, signaling that this is more than just a book—it is an advocacy platform.
Implications: The Future of Data-Literate Generations
The project has moved well beyond the pages of a book. The "Data2Kids" ecosystem now includes:

- The Data2Kids Competition: An international initiative aimed at encouraging children to create their own data visualizations.
- The Workbook: An interactive, in-development tool designed to facilitate hands-on data collection and chart-making for families.
- A Growing Community: A network of professionals and parents dedicated to promoting data literacy through creative play.
The implications for the industry are profound. By demystifying the professional lives of parents, Kolokolov and Kiseleva are helping to humanize the data profession. They are also seeding the market with future professionals who will view data not as a series of spreadsheets, but as a medium for storytelling and discovery.
Conclusion: A Legacy of Magic and Logic
As the authors look toward the spring and beyond, their goal remains focused: to bridge the gap between the professional world of business intelligence and the inquisitive mind of a child.

Whether it is through the adventures of Christine or the training of Piechi, Christine and the Magic Charts stands as a testament to the idea that no subject is too technical to be told as a story. For those interested in joining this movement, the authors invite participation through their official website and their published work, proving that even the most complex data can become a source of wonder if one knows how to visualize it properly.
In a world drowning in information, perhaps the most important skill we can teach our children is not just how to read data, but how to tell a story with it—turning the "pretty pictures" they see on our screens into the building blocks of their own future understanding.
 Lina Irawan
  Nila Kartika Wati