
"Who made this? Yes, I’m asking the source. I have to know, I have to know."
These were the first words out of Luke’s mouth when he was presented with a graph titled "Biden Gas Price Surge." What followed was not a simple analysis of trends or axis labels. For two hours, Luke—a college student—engaged in a relentless, forensic interrogation of the visual data. He dissected the timeline, cross-referenced the political context, and hunted for the intent behind the designer’s choices. His skepticism was sharp, his methodology rigorous, and his eventual conclusion—that the graph contained significant inconsistencies—was factually sound.
Yet, in the very same room, another student named Lara viewed the exact same graphic. When asked if the graph told an appropriate story, she didn’t pause to check the data’s provenance or verify the causal claims. Instead, she leaned into a familiar narrative, noting that the graph aligned with the political discourse she had heard in her hometown.
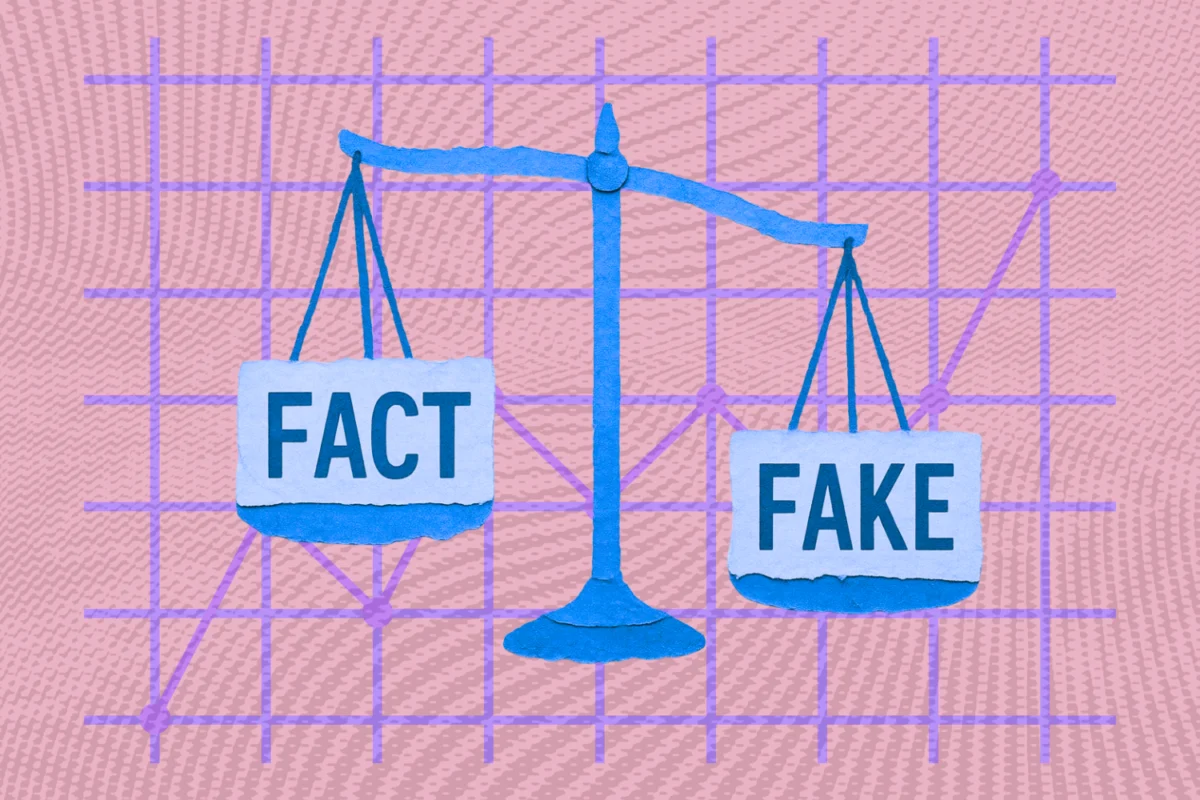
One graph. Two students. Two radically different outcomes.
For years, educators have operated under the assumption that teaching "graph literacy"—the ability to read coordinates, understand scales, and calculate slopes—would create a citizenry of objective, informed thinkers. However, recent research into how students interact with politically charged data suggests that we have been missing the forest for the trees. The crisis in modern data literacy is not a lack of technical skill; it is a profound failure of disposition.
The Anatomy of a Cognitive Divide
The divergence between Luke and Lara offers a window into a psychological phenomenon that is increasingly defining our public discourse. My research, conducted over several years while teaching mathematics and quantitative reasoning, involves clinical interviews with college students as they grapple with data visualizations concerning immigration, inflation, and government policy.
The results are consistent and unsettling: prior beliefs do not merely color the conclusions students draw; they dictate the entire investigative process. Before a student even registers the first data point, their worldview has already decided how much scrutiny the graph deserves.
Luke’s response was a textbook case of "motivated skepticism." He did not look at the graph as a neutral observer; he looked at it as a defense attorney protecting his ideological territory. Because the graph’s title explicitly challenged his political leanings, he deployed his critical thinking skills with laser-like precision to dismantle it.
Lara, conversely, exhibited "confirmation bias." Because the graph reinforced her existing mental model of government responsibility, she felt no cognitive dissonance. She accepted the information as a "given," bypassing the critical appraisal that the material required.

In both instances, the students were acting as sophisticated—though biased—interpreters of data. The problem is that our current educational model assumes that if we give students the "sword" of statistical literacy, they will use it to defend the truth. We failed to realize that we never taught them where to point the blade.
A Chronology of Curricular Misalignment
To understand why this gap exists, we must look at how we have historically taught mathematics.
For decades, the standard approach to graph literacy was defined by its sterility. Textbooks were populated with "safe" data: the hypothetical cost of watermelons, the average growth of bean sprouts, or the distribution of test scores. These exercises were designed to be clean, measurable, and entirely detached from the messy realities of the outside world. The goal was to teach the mechanics of a graph, assuming that the skills were universal and context-independent.
The Shift Toward Authenticity
In recent years, researchers and educators recognized that this sanitized approach left students ill-equipped for the digital age. We began to push for "authentic" data—real-world datasets and news media visualizations. We believed that by introducing the "real" into the classroom, we would bridge the gap between abstract math and civic engagement.
We were partially correct. Students did become more technically proficient. They could identify misleading axes and spot manipulated bars. But we made a critical error in judgment: we assumed that providing the skills would naturally lead to a neutral, objective application of those skills. We failed to account for the human element—the deep-seated, often subconscious, political and social histories that every student brings into the classroom.
The Mechanism of Motivated Skepticism
"Motivated skepticism" is not a lack of critical thinking; it is the weaponization of it. It is the practice of using one’s intellect not to find the truth, but to protect an established worldview from disruption.
When a person encounters information that contradicts their core beliefs, the brain triggers a defensive response. In the case of data visualization, this manifests as a high-intensity forensic audit. The reader starts questioning the source, the sample size, the color palette, and the underlying intent of the designer. While these are all valid and necessary steps for media literacy, they are being applied unevenly.
If the same person encounters a graph that confirms their bias, that "forensic" instinct vanishes. They skip the skepticism and move straight to validation.
Why the Curriculum Stalls
The fundamental issue is that our educational system treats graph literacy as a technical decoding skill rather than a social one. We teach the how of the graph, but we remain silent on the why of the reader. We assume the reader is a neutral, blank slate. In reality, the reader is a complex individual with a history, a community, and a set of values. When the "neutral" graph meets the "biased" reader, the resulting interaction is rarely objective.

Implications for Democracy and Education
The implications of this phenomenon extend far beyond the classroom. We live in an era where data is used as a rhetorical tool—a visual argument designed to persuade rather than inform. If our students only apply critical thinking to the graphs they disagree with, we are effectively training them to be partisan warriors rather than informed citizens.
The Necessity of Reflexivity
The solution is not to double down on teaching more complex statistical formulas or harder data analysis techniques. The solution is to introduce the concept of "reflexivity" into our curriculum.
Reflexivity requires students to ask: Why am I questioning this graph? Would I be as critical if this graph supported my own position? What are my own biases, and how are they shaping my interpretation of these numbers?
This is a much harder, more uncomfortable lesson. It requires students to look inward before they look outward. It asks them to acknowledge their own vulnerabilities to bias, which is a significant departure from the traditional, "objective" mathematics pedagogy.
Toward a New Framework of Data Literacy
If we are to prepare students for a future dominated by algorithmic content and politically charged visualizations, we must overhaul our approach.
- Move Beyond Technical Mastery: We must acknowledge that technical skill does not guarantee objective application.
- Normalize Bias: Educators should explicitly discuss confirmation bias and motivated skepticism as universal human traits, not as moral failings of a specific political group.
- Institutionalize Inquiry: We should teach students to apply the same level of scrutiny to information they like as they do to information they dislike.
- Contextualize the Designer: We must teach that every graph is an argument, crafted by a human being with a specific goal, and that acknowledging that goal is part of being a literate citizen.
The challenge is daunting. It is much easier to teach a student how to calculate a moving average than it is to teach them to interrogate their own subconscious commitments. But if we continue to focus solely on the "sword" of literacy without addressing the "hand" that wields it, we will continue to produce graduates who are technically capable but civically stunted—individuals who can decode a graph but cannot escape the pull of their own shadows.
We have spent years teaching students how to read the world. It is time we teach them how to read themselves.
