
In the hyper-competitive landscape of modern digital marketing, the vanity metric of "follower count" has largely been supplanted by a more potent indicator of brand health: Engagement Rate (ER). As algorithms prioritize meaningful interactions over passive scrolling, understanding how to measure, analyze, and optimize your engagement has become the cornerstone of a successful social media strategy.
Based on an expansive analysis of over one million social media posts conducted by Hootsuite in partnership with data science agency Critical Truth, this guide provides the definitive benchmarks and methodologies for 2026.

Main Facts: What is Engagement Rate?
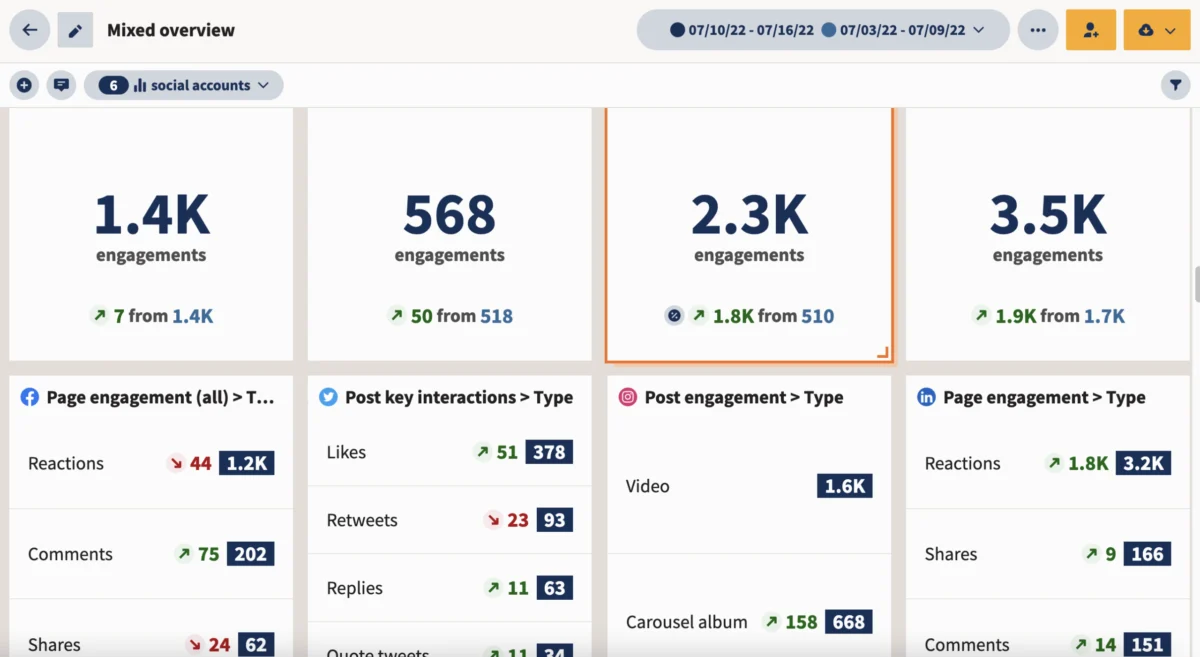
At its core, the engagement rate is a performance metric that quantifies how actively your audience interacts with your content. It serves as the bridge between your brand’s output and your audience’s reception. Whether you are measuring a single post, a specific campaign, or the performance of your entire account over a quarter, the engagement rate tells you one critical thing: Is your content actually connecting?
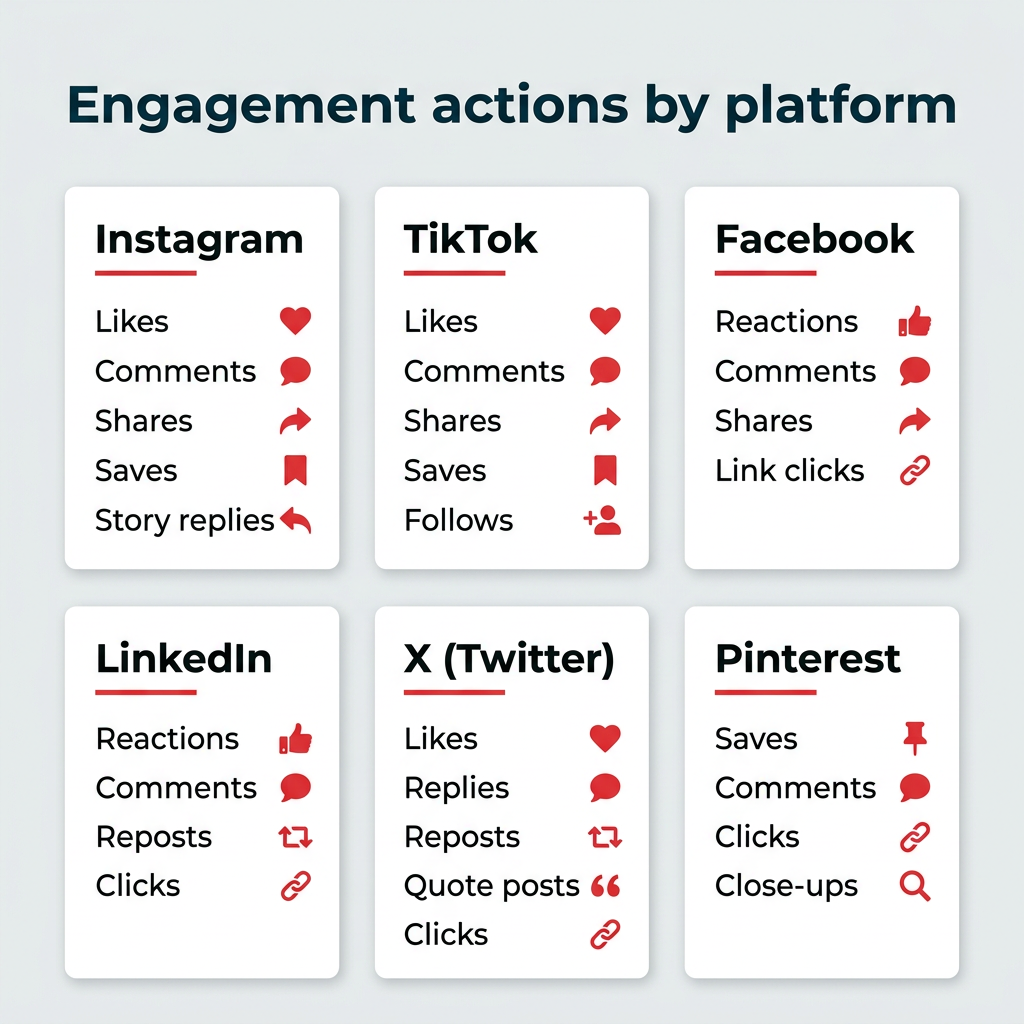
Engagement is defined by any proactive action a user takes, including:

- Likes and Reactions: The foundational signal of approval.
- Comments: A high-value indicator of conversation.
- Shares/Retweets: A metric of advocacy and virality.
- Saves/Bookmarks: A signal of long-term utility or interest.
- Direct Messages and Link Clicks: Indicators of bottom-funnel intent.
Passive metrics, such as impressions and views, do not constitute engagement on their own; they represent reach. By dividing your total interactions by these reach metrics, you gain a percentage that reflects the true "stickiness" of your brand voice.
The Strategic Implications: Why Engagement Matters
For the modern enterprise, engagement rate is not just a dashboard statistic; it is a primary driver of business outcomes.
- Algorithmic Favorability: Social platforms are designed to keep users on their apps. When users interact with your content, algorithms view this as a quality signal, surfacing your posts to broader audiences and new potential customers.
- Trust and Credibility: A profile with a high follower count but near-zero engagement can appear bought or irrelevant. Conversely, an active comment section signals to first-time visitors that your brand is a community hub, fostering trust.
- Proving ROI to Stakeholders: For marketing teams, engagement is the most transparent way to connect creative output to audience behavior. It provides a quantifiable narrative that leadership can understand, proving that social media is a revenue-generating channel rather than a cost center.
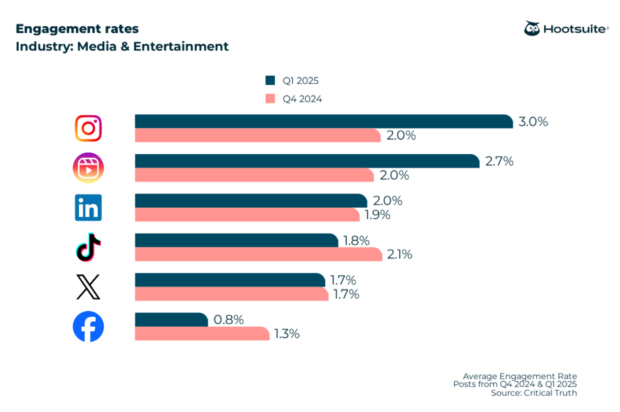
Supporting Data: 2026 Industry Benchmarks
To understand whether your performance is "good," you must measure it against the right context. A 1% engagement rate on LinkedIn might be a triumph, whereas the same rate on TikTok could signal a need for content pivot.
The All-Industry Baseline
Across all industries, engagement rates generally hover between 1% and 5%. However, the platform variance is significant:
| Platform | Average Engagement Rate (All Industries) |
|---|---|
| 3.0% | |
| Instagram Reels | 2.7% |
| 2.0% | |
| X (Twitter) | 1.8% |
| TikTok | 1.5% |
| 0.8% |
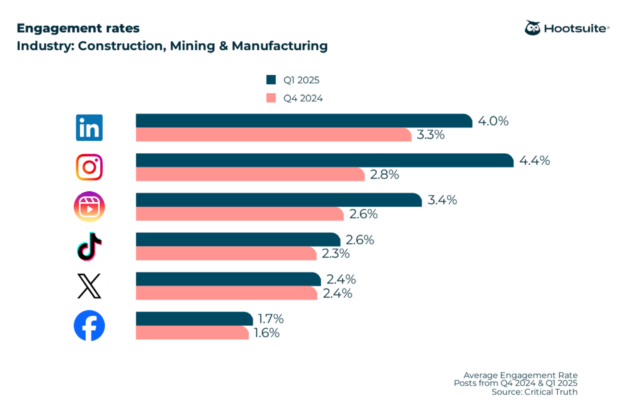
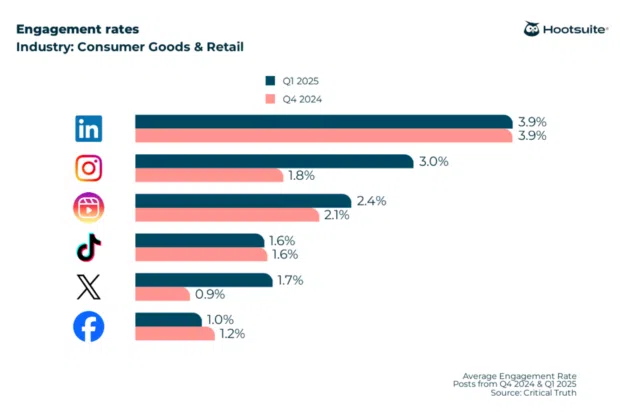
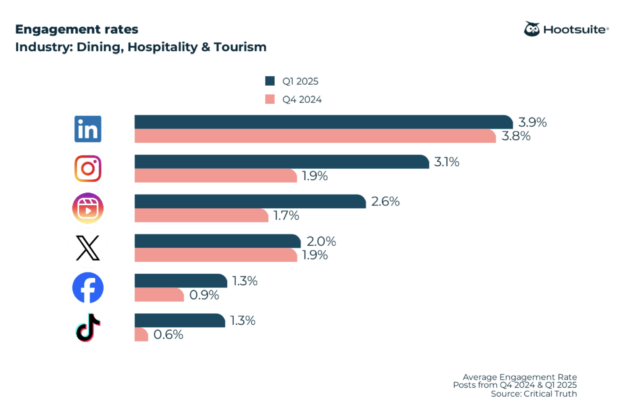
Industry-Specific Snapshots
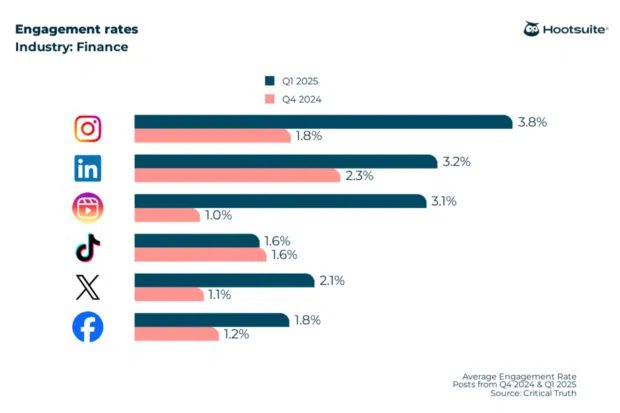
The data reveals that industry norms dictate expectations. For instance, in the Construction, Mining, and Manufacturing sector, Instagram leads with a robust 4.4% engagement rate. Meanwhile, the Nonprofit sector also sees a 4.4% engagement rate on Instagram, highlighting the power of visual storytelling for mission-driven organizations. In Financial Services, Instagram remains the primary engagement driver at 3.8%, showcasing the effectiveness of humanizing complex financial topics through short-form video.

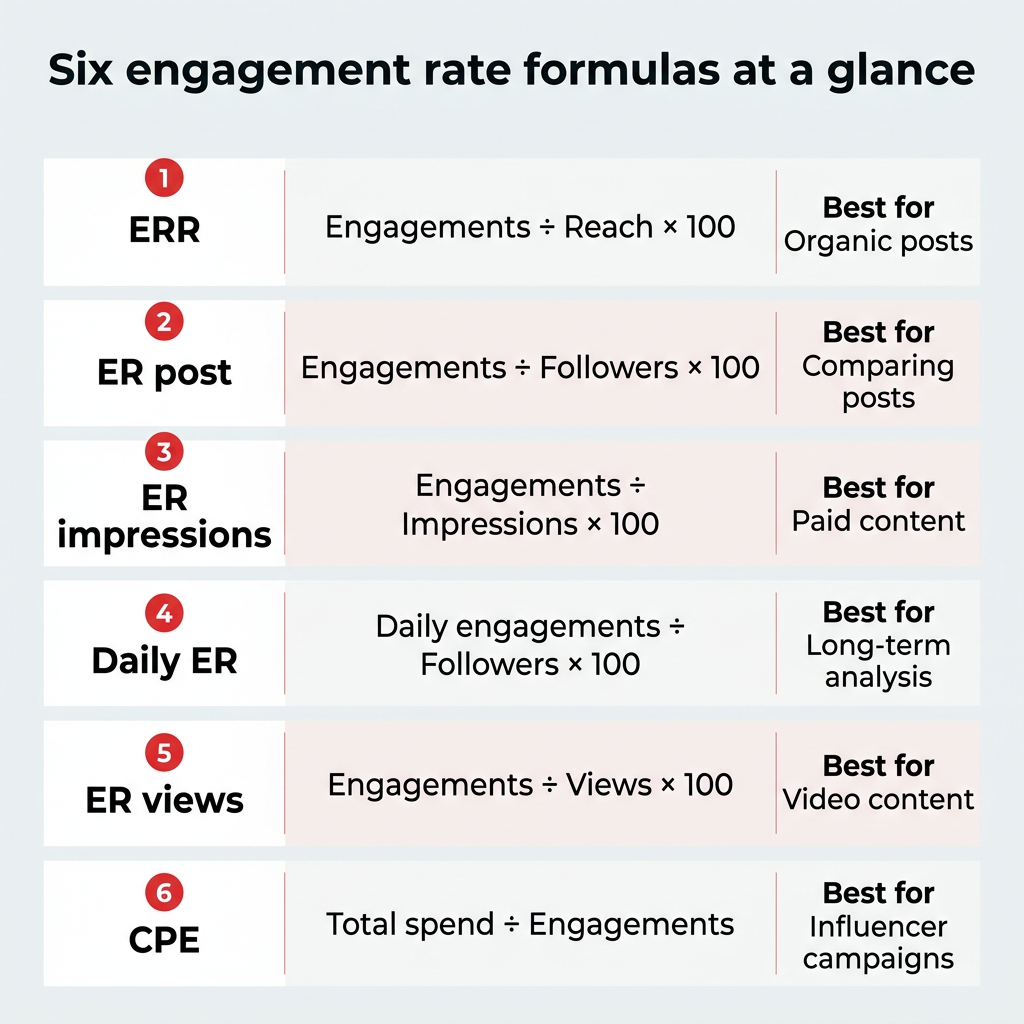
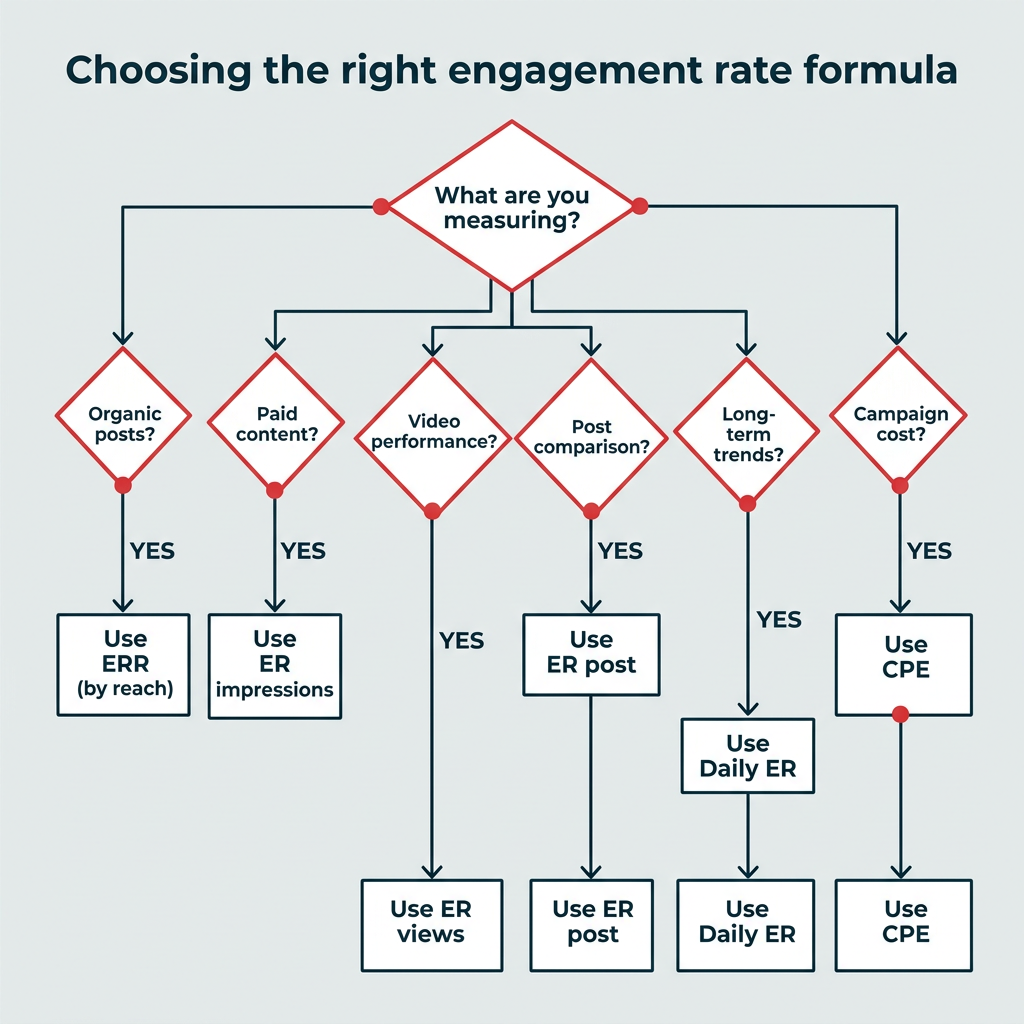
Mastering the Formulas: How to Calculate Your Performance
Choosing the right formula is as important as the calculation itself. The "denominator" you choose changes the story the data tells.
1. Engagement Rate by Reach (ERR) – The Gold Standard
- Formula: (Total Engagements / Reach) * 100
- Why use it: This is the most accurate measure for organic posts. It tells you what percentage of people who actually saw your content were moved to interact with it.
2. Engagement Rate by Post (ER Post) – The Comparison Tool
- Formula: (Total Engagements / Total Followers) * 100
- Why use it: Ideal for comparing individual posts against each other over time. It provides a stable baseline, though it does not account for viral reach outside your follower base.
3. Engagement Rate by Impressions (ER Impressions) – The Paid Specialist
- Formula: (Total Engagements / Total Impressions) * 100
- Why use it: Essential for paid advertising campaigns. Because impressions count repeat views, this rate is usually lower, but it is the industry standard for measuring CPM-based effectiveness.
4. Daily Engagement Rate (Daily ER) – The Long-Term Metric
- Formula: (Total Daily Engagements / Total Followers) * 100
- Why use it: This measures the "heartbeat" of your account. It captures engagement on both new and evergreen content, revealing how often your audience thinks about your brand on an average day.
Chronology: Improving Your Engagement Strategy
Improving your engagement rate is a continuous, iterative cycle. Here is the recommended approach for any marketing team:
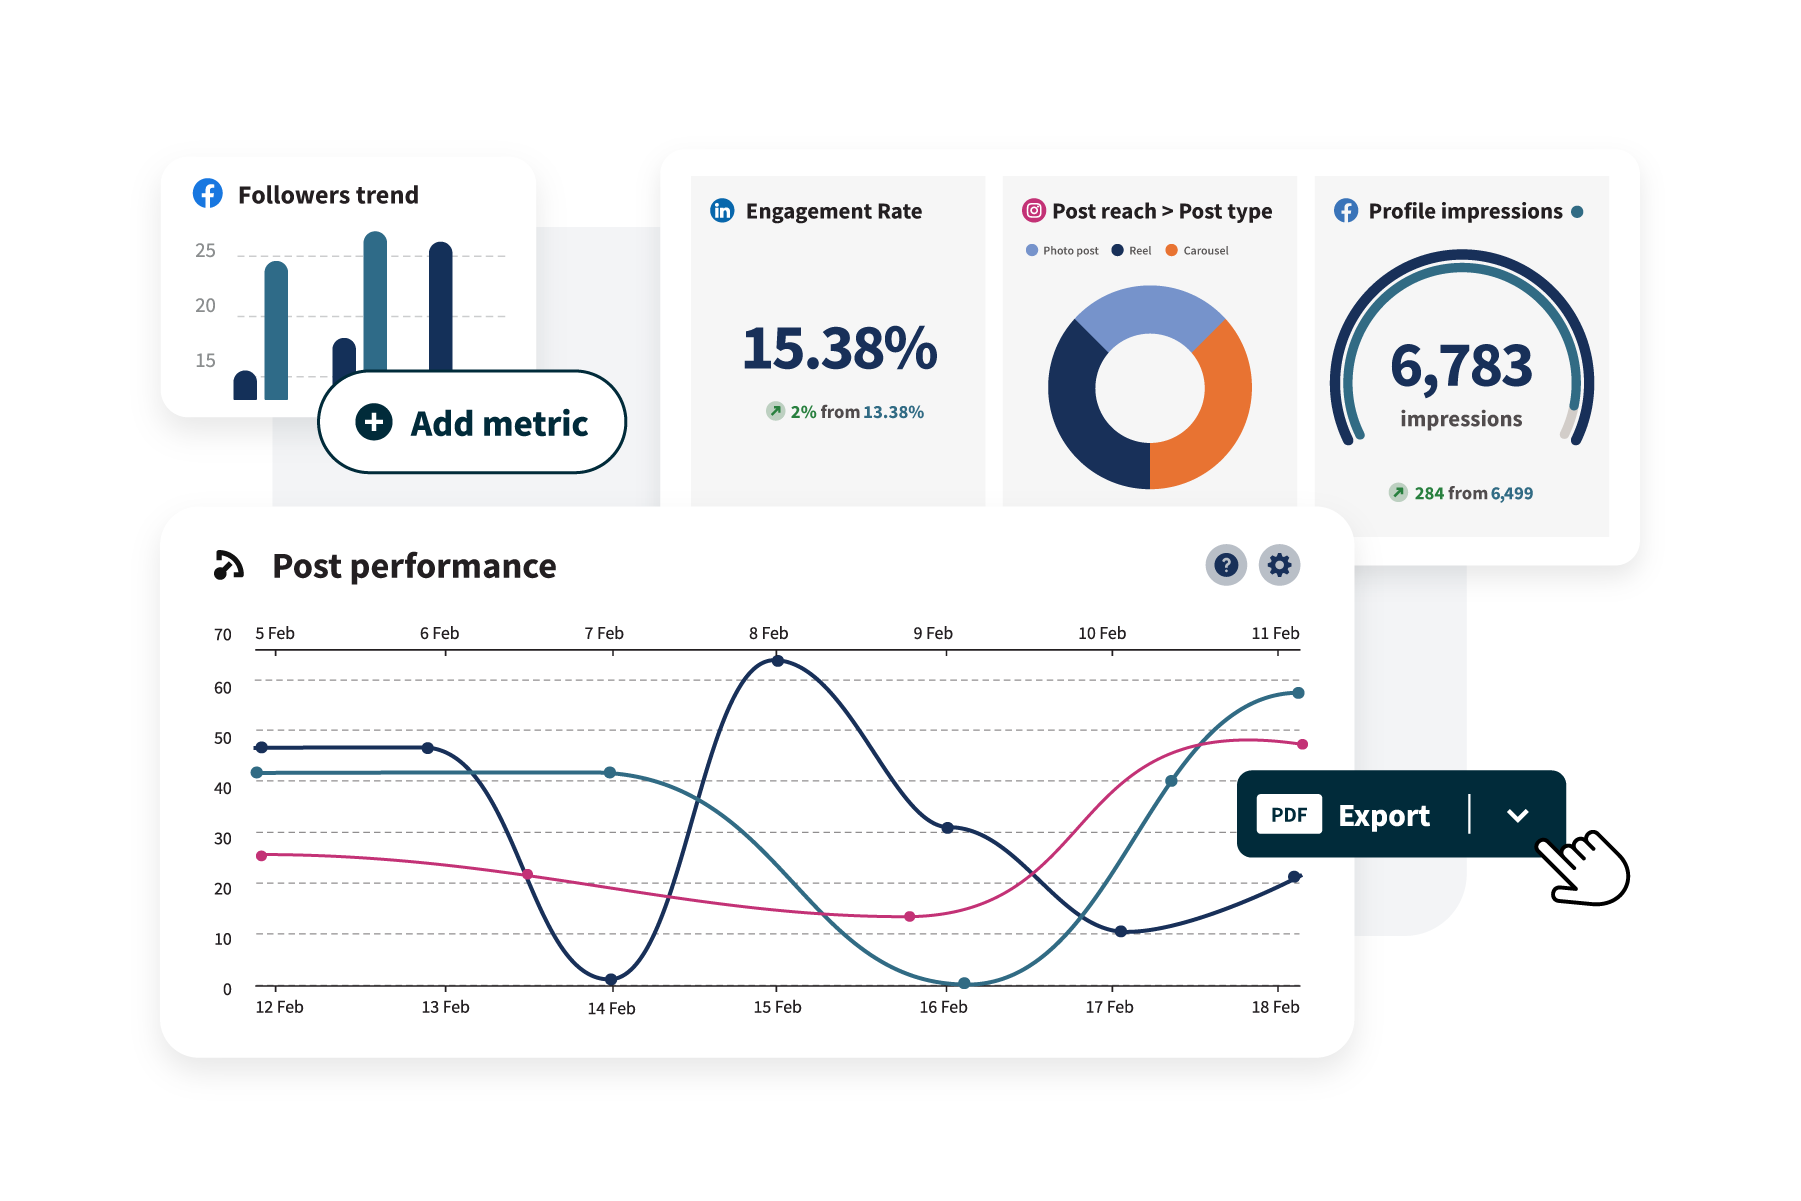
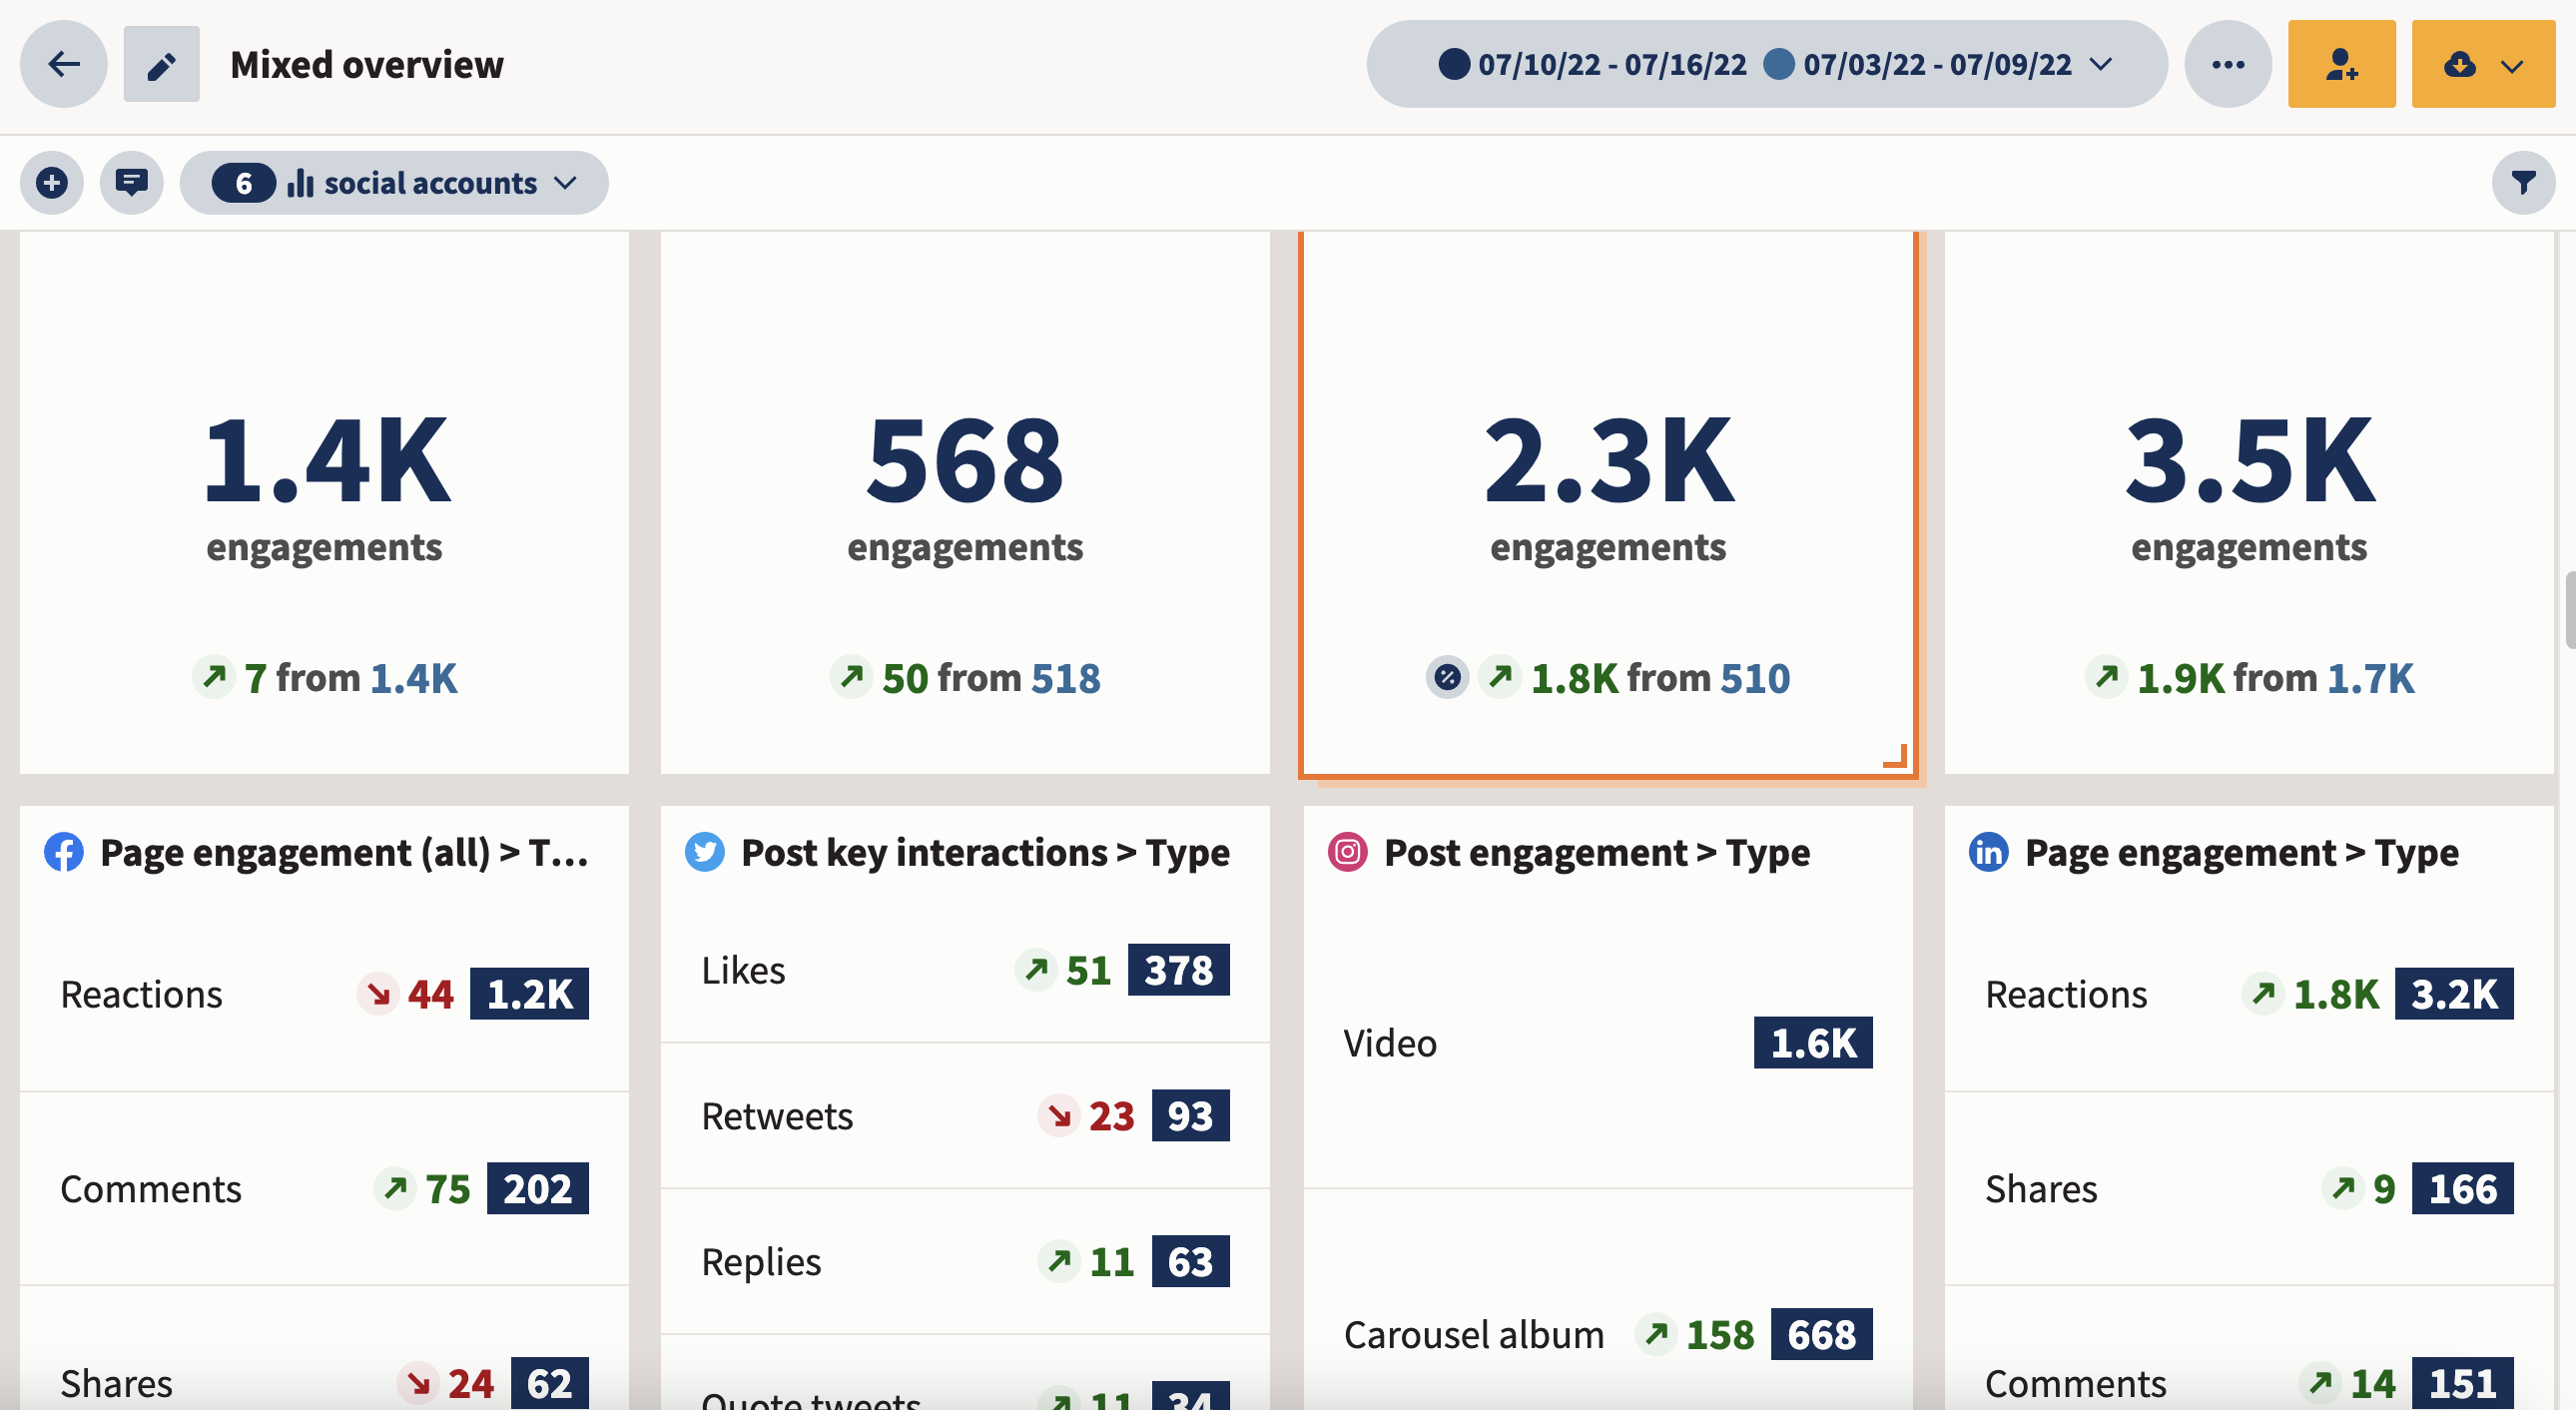
- Phase 1: The Audit (Weeks 1-2): Use an analytics tool (such as Hootsuite Analytics) to pull data from the last quarter. Identify which posts performed above the industry average and which fell flat.
- Phase 2: The Pattern Recognition (Weeks 3-4): Analyze the variables of your high-performing posts. Was it the format (Reels vs. Carousels)? The time of day? The tone of the caption?
- Phase 3: The Optimization (Month 2): Implement a testing schedule. If your audience responds to educational carousels, increase their frequency. Experiment with different "Calls to Action" (CTAs) to see if asking a question vs. inviting a click yields higher results.
- Phase 4: The Community Loop (Ongoing): The most overlooked tactic for increasing engagement is the "reply-back." When you treat your comments section as a customer service channel or a conversation lounge, you build loyalty. The more you reply, the more your audience feels encouraged to engage in the future.
Official Responses: Expert Insights on 2026 Trends
According to industry data, the shift toward "social search" is changing how we define engagement. Users are increasingly using platforms like TikTok and Instagram as search engines. Consequently, saves and shares are becoming more valuable to algorithms than simple likes.
"The era of chasing vanity likes is over," says industry analysis. "The 2026 strategy is about utility. If a user saves your post, they are signaling to the platform that your content is high-value. This creates a powerful ‘quality signal’ that outweighs a thousand mindless likes."
Summary and Implications
Engagement rate is the heartbeat of your social media strategy. It is not merely a number to be tracked in a monthly report; it is a diagnostic tool that reveals the health of your relationship with your audience.
Key takeaways for your 2026 strategy:
- Focus on the right denominator: Use ERR for organic reach and ER by Impressions for paid performance.
- Context is King: Do not compare your Facebook engagement to your Instagram engagement. Use the industry-specific benchmarks provided by platforms like Hootsuite to set realistic goals.
- Consistency beats intensity: A 0.5% increase in engagement achieved through consistent community interaction and high-value content is more sustainable than a viral fluke.
By leveraging automated tools to handle the heavy lifting of data collection, marketing teams can spend less time in spreadsheets and more time crafting the human-centric content that drives real-world interaction. Remember, behind every engagement rate is a real person. When you optimize for their interest, the metrics will naturally follow.
