
In the high-stakes digital economy of the late 2020s, the definition of a "broken" interface has shifted. It is no longer measured merely by "lost clicks" or aesthetic displeasure; it is measured in millions of dollars of wasted engineering spend, plummeting retention rates, and eroded brand equity. As digital products become the primary—and often only—touchpoint between a brand and its consumer, User Experience (UX) has transitioned from a cosmetic preference to a non-negotiable requirement for business survival.
Veteran UX designer Carrie Webster, alongside data from global institutions like IBM and McKinsey, argues that the boardroom can no longer afford to view design as a "visual" role. Instead, UX must be recognized as a research-driven, data-backed discipline that serves as the primary engine for revenue, retention, and long-term growth.
1. The Ten Clinical Pillars of UX ROI
To bridge the gap between the design studio and the boardroom, stakeholders must move past intuition and look at the clinical, data-backed pillars of financial growth. The following ten facts represent the current reality of the digital marketplace.
I. The 1:100 Rule: Engineering Insurance
One of the most compelling financial arguments for UX is the "1:100 rule." Studies from the IBM Systems Institute and Sugue Technologies demonstrate that fixing a defect after a product has been launched can be up to 100 times more expensive than addressing it during the initial design and prototyping phase. In this context, UX is "engineering insurance." By validating interactions before a single line of code is written, companies avoid the compounding costs of technical debt and lost developer time.

II. The Performance Threshold
In a world of near-instant gratification, performance is the foundation of experience. Data reveals that 47% of users expect a page to load in two seconds or less. Missing this window is a financial catastrophe: a one-second delay can reduce conversions by 20% and customer satisfaction by 16%. Conversely, even a 0.1-second improvement can lift retail conversions by 8.4%.
III. The 50-Millisecond Impression
First impressions are visceral and aesthetic. Research indicates that users form an opinion about a website’s visual appeal in approximately 50 milliseconds (0.05 seconds). This split-second "gut feeling" is a survival mechanism; 94% of these first impressions are strictly design-related. If the interface feels dated or cluttered, the user subconsciously projects that lack of quality onto the entire service.
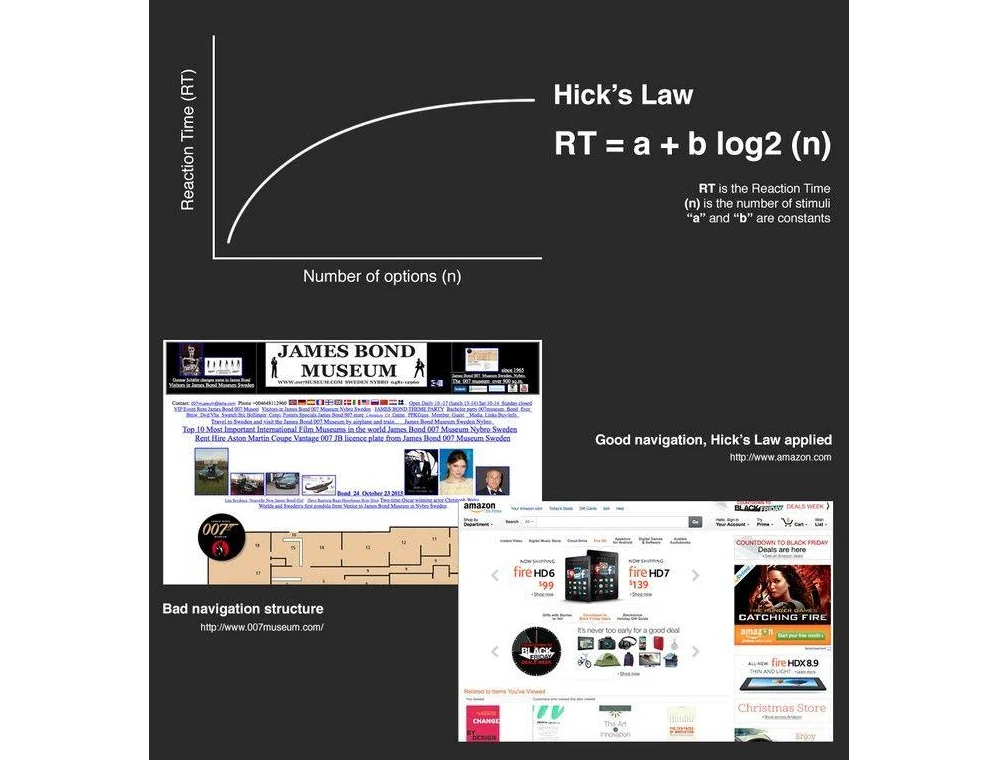
IV. Hick’s Law and the Cost of Overwhelm
Stakeholders often mistakenly equate "more options" with "more value." Psychology proves the opposite through Hick’s Law, which states that the time it takes to make a decision increases with the number of options available. Top-performing sites now achieve conversion rates exceeding 11% by aggressively simplifying the user journey and removing cognitive "taxes" like unnecessary form fields.
V. White Space as a Comprehension Tool
Non-designers often view white space as "wasted real estate." However, strategic use of white space increases content comprehension by up to 20%. By preventing cognitive load from peaking, white space guides the user’s eye toward the most critical elements—typically the "Buy" or "Sign Up" buttons.

VI. The Goal Gradient Effect
The "Goal Gradient Effect" suggests that users will complete a task faster if they believe they have already made progress. In digital design, showing a progress bar that starts at 15% (simply for creating an account) can increase onboarding completion rates by over 40%. UX is, in essence, the management of user momentum and dopamine.
VII. Typography as a Conversion Lever
Legibility is a conversion tool. Proper typography—specifically line spacing (leading) and paragraph width—can increase content comprehension and reading speed by 20%. When users struggle to read text, their "perceived effort" increases, leading to higher bounce rates. If it is hard to read, it is hard to buy.
VIII. The Scanning Culture
Modern users do not read; they scan. On a typical web page, users read only 20% to 28% of the text, following an "F-pattern." Designing for reading is a tactical error; designing for scanning—using headers, bullet points, and bold text—is a requirement for engagement.
IX. The Mathematical "Rule of Five"
Massive user studies are often a waste of resources. Testing with just five users typically uncovers 85% of usability problems. Beyond five, companies reach a point of diminishing returns. The competitive advantage lies in small, frequent, and iterative testing cycles rather than monolithic, infrequent studies.

X. The 9,900% Return on Investment
The most staggering statistic in the industry remains the $1:$100 ratio. On average, every dollar invested in UX returns $100. This ROI is the cumulative result of increased conversion rates (which can jump by 400% with optimized UX) and significantly lower customer support requirements.
2. A Chronology of the UX Paradigm Shift
To understand why these facts are so critical today, one must look at the evolution of the digital interface over the last two decades.
- The Utility Era (2000–2010): In the early days of the web, "it works" was enough. Design was secondary to basic functionality. UX was often an afterthought handled by developers.
- The Mobile-First Revolution (2010–2018): As smartphones became ubiquitous, the "friction-heavy" interfaces of the desktop era began to fail. This period saw the rise of responsive design and the first major recognition that load times were directly tied to revenue.
- The Maturity Era (2018–2024): Led by companies like Airbnb and Apple, design became a core business strategy. The "Experience Gap" was identified: 80% of companies believed they delivered a superior experience, while only 8% of customers agreed.
- The Intelligent UX Era (2025–Present): Today, we have entered an era where AI-driven personalization and predictive design are standard. However, while the tools have changed, the fundamental laws of human psychology—our 50ms judgments and our need for simplicity—remain the bedrock of the industry.
3. Supporting Data: The McKinsey and Forrester Findings
The financial impact of UX is further validated by major consulting firms. A landmark study by McKinsey & Company tracked the design practices of 300 publicly listed companies over five years. They found that those with the highest "McKinsey Design Index" (MDI) scores outperformed the industry benchmark by a factor of two. Specifically, these companies saw 32% higher revenue growth and 56% higher total returns to shareholders compared to their peers.
Furthermore, Forrester Research has highlighted that a well-designed user interface can raise a website’s conversion rate by up to 200%, while a better UX design (focused on the total journey) can yield conversion rates up to 400%. These figures underscore that UX is not a "soft" metric but a hard financial driver.

4. Official Responses and Industry Perspectives
Industry leaders are increasingly vocal about the shift from "aesthetic design" to "strategic design."
The Engineering Perspective:
Chief Technology Officers (CTOs) are beginning to view UX as a method to reduce "rework." As an IBM report recently stated: "The cost of a bug found during requirements is $1. The cost of that same bug found in the design phase is $10. Once it hits code, it’s $100." This perspective has turned UX designers into essential partners for engineering teams.
The Executive Perspective:
In the boardroom, the focus has shifted toward "User Efficiency." When a workflow for a team of 1,000 employees is shortened by 30 seconds through better UX, the company reclaims hundreds of thousands of dollars in annual productivity. This "Internal ROI" is now a key KPI for enterprise software procurement.
The AI Integration Perspective:
With the rise of Generative AI, Adobe and other tech giants have noted that AI can now handle the "heavy lifting" of design—such as creating variants for A/B testing or automating accessibility audits. However, they maintain that human-centric UX research is more vital than ever to ensure that AI-generated interfaces remain grounded in human psychology.

5. Implications for the Future of Business
The data leads to a singular conclusion: the line between "design" and "business strategy" has vanished. Companies that lead in design outperform their competitors by 1.7x in revenue growth.
Capturing "Left" Market Share
The "Experience Gap" represents a significant market opportunity. By bridging the disconnect between what a company thinks it provides and what the customer actually experiences, businesses can capture market share that competitors are leaving on the table due to friction-heavy interfaces.
The Productivity Dividend
Beyond consumer-facing apps, the optimization of internal tools is the next frontier of UX. As the workforce becomes more distributed and digital-reliant, the efficiency of the "Internal UX" will dictate the agility of the entire organization.
The Death of Subjective Opinion
We have moved past the era of "I like this color better." In the modern boardroom, design decisions are made based on heatmaps, conversion data, load-time benchmarks, and user testing results. The most successful firms are those that treat UX as a continuous improvement loop rather than a one-off project.

Conclusion
UX design is no longer a luxury or a final coat of paint; it is the research-driven, data-backed discipline that ensures a digital product is a revenue-generating machine rather than a cost center. The facts are clear, the psychology is proven, and the ROI is undeniable. As we move deeper into the decade, the only remaining question for business leaders is whether they will let the data lead their design, or if they will let their competitors do it first.
