By Kemi Elizabeth Ojogbede Technical Curriculum Developer, GraphAcademy
Main Facts
In an era defined by internet fandoms, massive cross-media adaptations, and an insatiable appetite for pop-culture lore, few ancient texts have experienced a renaissance quite like Homer’s The Odyssey. Recently, two divergent interpretations of the 2,700-year-old epic have captured the digital zeitgeist: EPIC: The Musical, an ambitious musical retelling whose cast was famously sourced through TikTok, and Christopher Nolan’s blockbuster film adaptation featuring Matt Damon in the titular role of the cunning Greek king.
While these modern adaptations sparked endless online debates regarding narrative choices, omissions, and artistic liberties, they also inspired a unique data science experiment. By hand-building a comprehensive dataset tracking 130 nodes—comprising heroes, gods, monsters, mortals, locations, musical tracks, and actors—alongside 235 distinct relational rows, data architect Kemi Elizabeth Ojogbede set out to settle fandom arguments using empirical mapping.
However, the resulting visualization yielded a profound lesson that extends far beyond classical literature: traditional tabular data storage can systematically hide structural errors. While spreadsheets and CSV files present information as clean, orderly rows and columns that easily conceal missing contextual links, force-directed graph visualizations instantly expose structural gaps. A mere 10-second query bridging Telemachus to Menelaus resolved an isolated cluster of Trojan War characters, proving that when structural relationships are missing, a graph acts as an immediate diagnostic tool.
Chronology: From Fandom Debates to Graph-Driven Discovery
Phase 1: The Spreadsheet Accumulation
The project began as an evening endeavor to quantify the overlapping canons of Homer’s epic, the TikTok-born musical, and the Hollywood film. Working primarily from Emily Wilson’s celebrated translation of the poem, Ojogbede cataloged 130 entities into a primary CSV file. A secondary CSV file mapped the interactions between these entities across 235 relational rows, formatted cleanly as subject-verb-object triplets (e.g., Odysseus BLINDS Polyphemus, Poseidon OPPOSES Odysseus).
At first glance, the spreadsheet appeared flawless. Every individual row was factually accurate, neatly organized, and alphabetically consistent. Scrolling through the database revealed no apparent anomalies, validating the false assumption that tidy tables equate to structurally sound data.
Phase 2: Loading the Graph Database
To better capture the narrative flow, the dataset was migrated into Neo4j Aura’s free-tier graph database using short Cypher scripts. Unlike traditional tables, which store entities independently and hint at connections through matching identification values, graph databases store relationships (edges) as direct, first-class objects bridging data points (nodes).
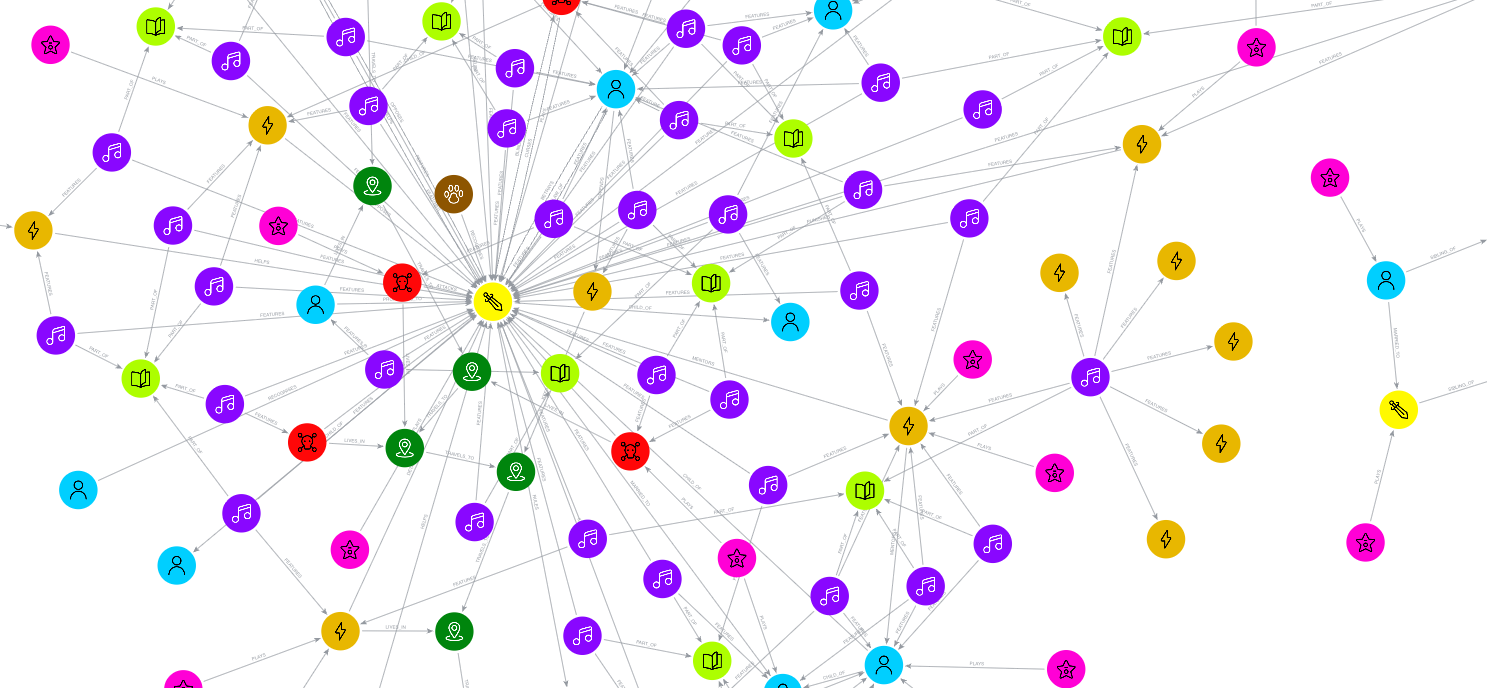
As the query executed, the 130 nodes blossomed outward across the canvas in a force-directed layout, forming an intricate, color-coded constellation representing characters, musical numbers, and cinematic adaptations.
Phase 3: The Discovery of the Isolated Island
Despite the initial visual aesthetic appeal, a critical structural flaw immediately emerged from the layout. Isolated on the periphery of the canvas, entirely disconnected from the main narrative arc of Odysseus’s journey, sat a distinct cluster of data points: Agamemnon, Menelaus, Helen of Troy, Clytemnestra, and their respective actors.
While internal relationships—such as marriages and sibling ties—kept these nodes linked to one another, they shared no pathways connecting them to the broader tapestry of the Trojan War or Odysseus’s adventures. Weeks of meticulous table-reading had completely missed this massive structural severance.
Phase 4: The Ten-Second Repair
The resolution required a single, elegant intervention rooted in Book 4 of Homer’s epic, wherein Odysseus’s son, Telemachus, journeys to Sparta to visit Menelaus in search of news regarding his missing father. Writing three concise lines of Cypher code to establish the VISITS relationship—MATCH (t:Character name: "Telemachus"), MATCH (m:Character name: "Menelaus"), and MERGE (t)-[:VISITS]->(m)—instantly snapped the isolated island into alignment with the rest of the narrative graph.
Supporting Data: Tables vs. Graphs
Understanding the distinct utility of tables versus graphs requires analyzing how different data structures process information and expose errors.
Feature / Metric
Relational Tables (Spreadsheets / CSV)
Graph Databases (Neo4j / Network Models)
Primary Unit
Rows and Columns (Attributes and Values)
Nodes and Edges (Entities and Relationships)
Handling of Relationships
Implicit (via foreign keys, matching IDs, or text strings)
Explicit (stored as physical arrows/links between entities)
Ideal Error Detection
Value-based errors (duplicates, null cells, typos, math discrepancies)
Low (requires manual sorting, filtering, or conditional formatting)
High (force-directed layouts instantly reveal clusters and gaps)
Query Complexity for Paths
High (demands multiple costly JOIN operations)
Low (traverses native pointers instantly)
As demonstrated during the mapping of The Odyssey, tables excel at quantitative verification—such as identifying that a row count of 125 does not match an expected total of 130. Conversely, graphs excel at qualitative topology, where the absence of a link creates a visual vacuum that immediately catches the human eye.
Official Perspectives and Expert Commentary
Data science and developer education communities have increasingly emphasized the necessity of multi-model data architectures. According to technical curriculum developers at Neo4j’s GraphAcademy, the limitation of traditional relational thinking lies in its rigidity when handling interconnected domains.
"A table with a missing row doesn’t look broken, and that’s the whole problem," notes Kemi Elizabeth Ojogbede in her technical documentation. "If the error is in a value, a table will catch it. If the error is in a connection, a graph will show it—because only a graph treats connections as real things that can be visibly missing."
Industry experts across various sectors have echoed this sentiment, noting that complex systems—ranging from supply chain logistics and cybersecurity threat intelligence to organizational hierarchies and social network analysis—frequently suffer from "blind spots" that evade standard tabular audits. When relationships are treated merely as background metadata rather than core structural elements, critical systemic vulnerabilities remain hidden in plain sight.
Implications for Modern Data Architecture and Analysis
The lessons learned from mapping a 2,700-year-old epic poem carry profound real-world implications for modern data engineering, compliance, and investigative journalism.
1. The Danger of Silent Disconnection
In corporate environments, organizational charts often reside in spreadsheets where departments or individual contributors become detached from leadership oversight without triggering automated validation flags. Similarly, in software engineering, dependency mapping that relies solely on tabular manifests can miss orphaned microservices that lack integration points within a broader architecture.
2. Fraud Detection and Cybersecurity
Financial investigators frequently encounter sophisticated fraud rings where seemingly unrelated shell companies share subtle relational markers, such as a single telephone number, an identical physical address, or shared corporate officers. While individual rows in a financial ledger may appear compliant and legitimate, force-directed graph layouts instantly cluster these hidden connections, exposing coordinated illicit networks that standard spreadsheet filters fail to flag.
3. Redefining Data Quality Assurance
Traditional data quality frameworks focus heavily on schema validation, missing value imputation, and type checking. The Odyssey graph experiment suggests that modern data hygiene must expand to include topological validation—testing whether the network architecture of a dataset accurately reflects the real-world domain it aims to represent.
By stepping outside the traditional confines of rows and columns, data analysts can transform complex information landscapes from opaque spreadsheets into intuitive visual constellations, ensuring that hidden structural errors—whether ancient plot holes or modern operational gaps—are brought swiftly to light.

 By Asep Darmawan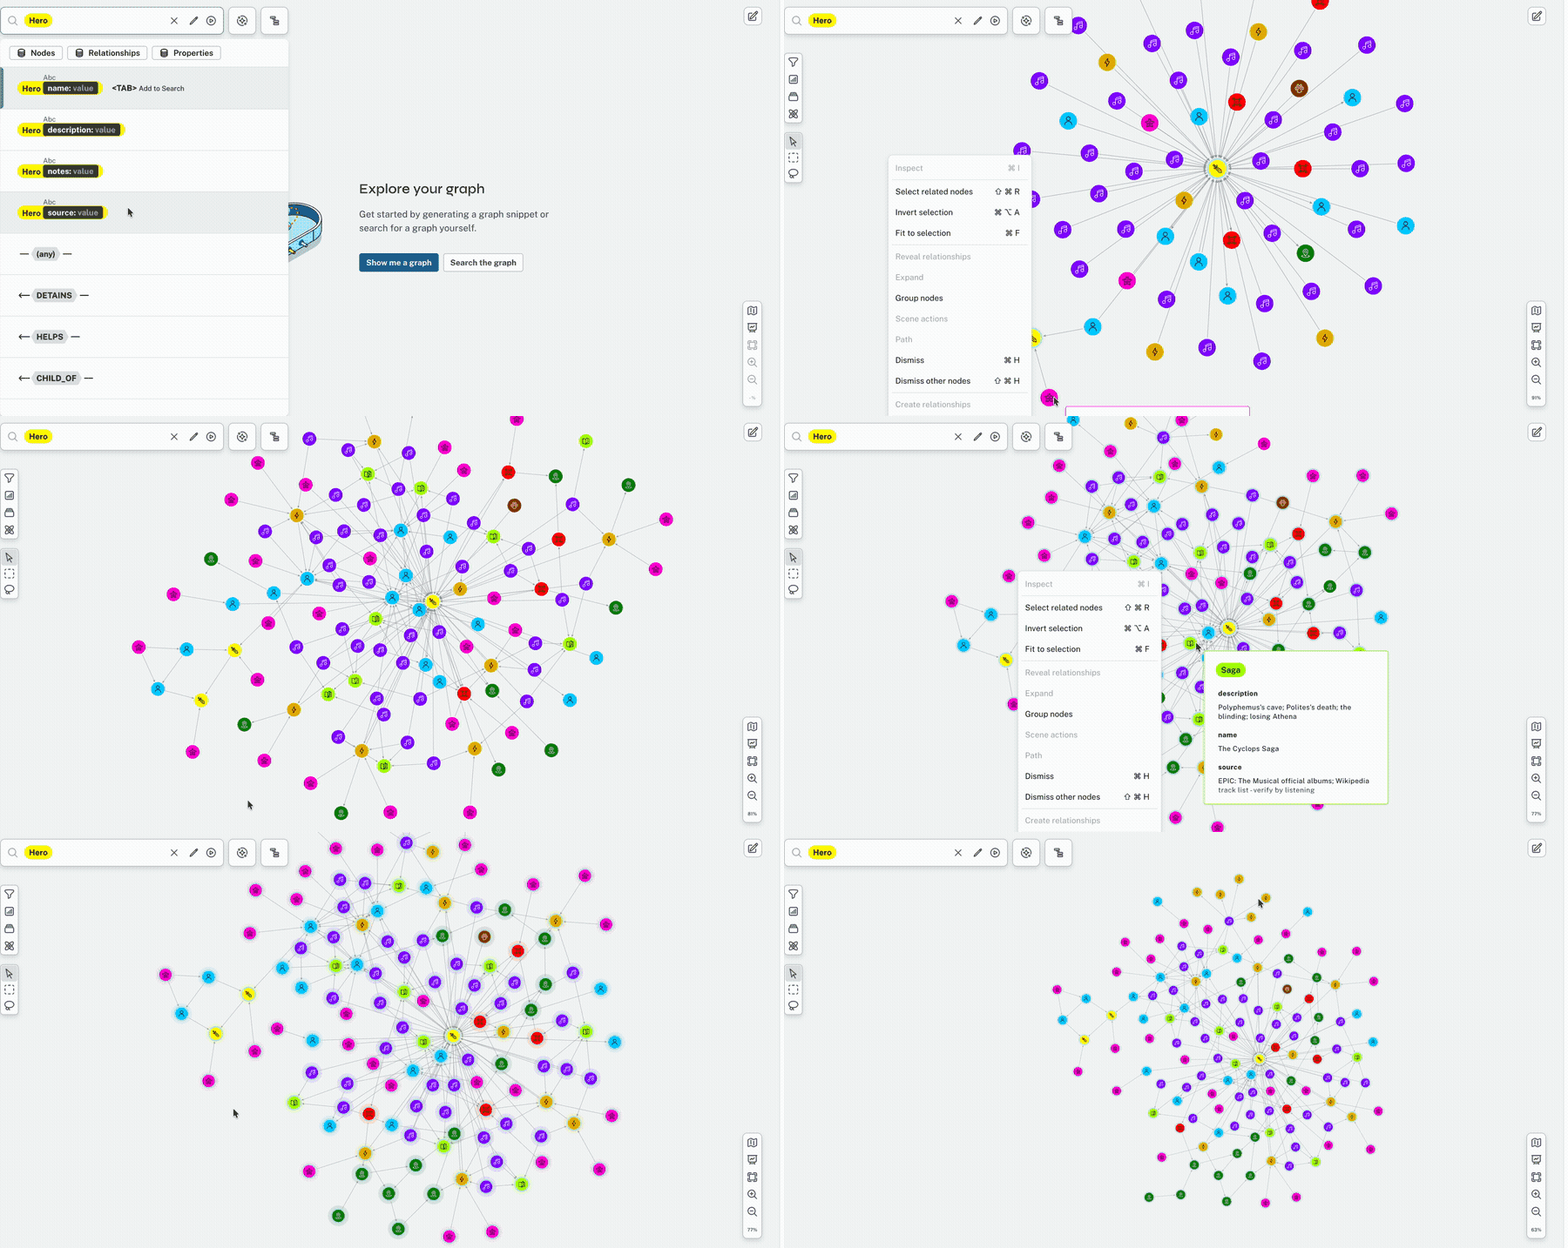


 Lina Irawan
  Nana
Nana  Nila Kartika Wati