
 By rifanmuazin
In the digital age, epic poetry and modern pop culture frequently collide in unexpected ways. Recently, internet fandoms have been consumed by two very different adaptations of Homer’s 2,700-year-old epic, The Odyssey: EPIC: The Musical, a viral sensation that built its cast organically through TikTok auditions, and Christopher Nolan’s high-budget feature film starring Matt Damon as the legendary, battle-weary king of Ithaca.
Despite utilizing the exact same foundational source material, these modern interpretations make radically different narrative choices. Naturally, this has sparked endless, impassioned debates across social media regarding narrative omissions, character adaptations, and creative liberties.
Determined to settle these fandom arguments with cold, hard metrics, data specialist and technical curriculum developer Kemi Elizabeth Ojogbede embarked on a meticulous project. She spent her evenings hand-building a comprehensive dataset mapping the entire story, its modern adaptations, and the intricate webs of characters connecting them.
What began as a quest to resolve online trivia disputes, however, ultimately yielded a much larger methodological discovery: a striking demonstration of how traditional tabular data can hide structural errors in plain sight, and how graph databases can instantly reveal what spreadsheets completely miss.
Main Facts: The Intersection of Ancient Myth and Modern Data
At its core, Ojogbede’s project was designed to construct a holistic, relational view of The Odyssey alongside its contemporary iterations. Working primarily from Emily Wilson’s acclaimed translation of the ancient Greek text, she cross-referenced the narrative details against the official cast lists and song registries of both the viral musical and the upcoming cinematic adaptation.
The resulting data model comprised two core components organized across CSV files:
- The Nodes (130 total): Representing every hero, god, monster, mortal, location, musical track, and actor featured within the ecosystem.
- The Relationships (235 rows): Describing the interactions and ties between those entities, structured like minimalist sentences (e.g.,
Odysseus$rightarrow$BLINDS$rightarrow$Polyphemus).
While tables and spreadsheets offered a clean, organized initial interface for data entry, they fundamentally altered how errors could—or couldn’t—be detected. Every single row within Ojogbede’s spreadsheets was factually correct. Yet, this accuracy presented a deceptive trap: the error did not reside within the individual rows, but rather between them—a structural nuance that a standard grid layout was fundamentally unequipped to display.
Chronology of the Discovery: From Spreadsheet to Constellation
The project evolved through distinct methodological phases, transitioning from manual data input to advanced graph visualization.

Phase 1: The Spreadsheet Illusion
During the initial data-entry phase, the information lived entirely in tidy columns and rows. Scrolling through the database revealed nothing out of the ordinary. Names were consistent, attributes matched source materials, and spot-checks confirmed that every individual record was historically and textually accurate. Because tabular structures rely on independent rows, they treat data points as discrete entries rather than continuous, web-like dependencies.
Phase 2: The Constellation Blooms
Seeking a more intuitive way to analyze the sentence-like structure of her data (NOUN $rightarrow$ VERB $rightarrow$ NOUN), Ojogbede turned to Neo4j Aura’s free tier, a graph database featuring an out-of-the-box visualization tool. Using brief Cypher scripts, she loaded her dataset.
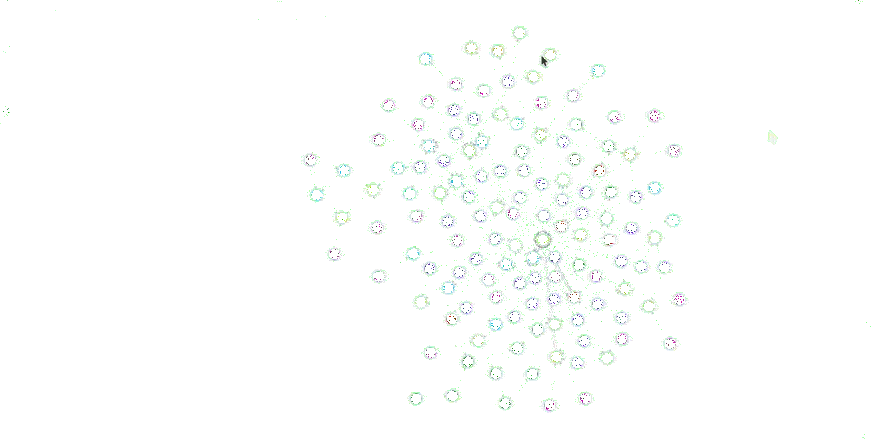
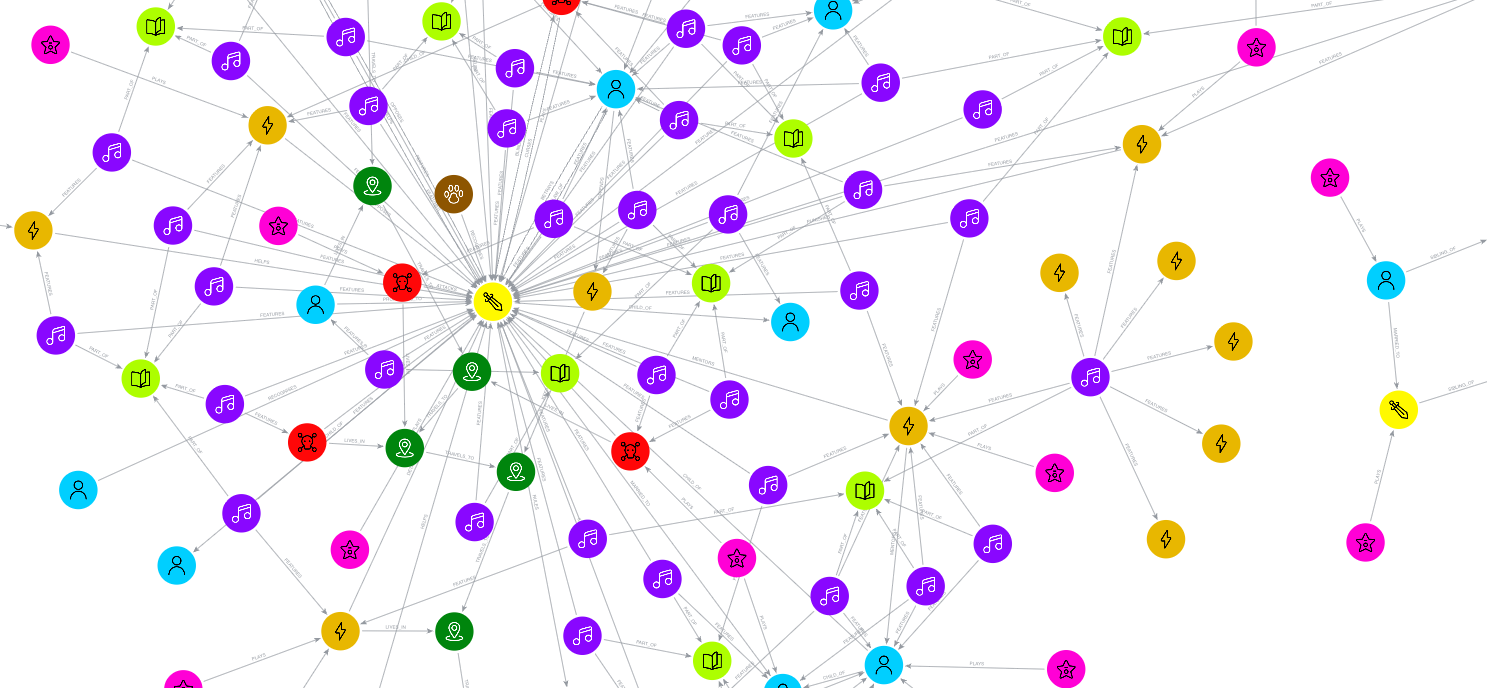
The moment of transition was transformative. As the queries executed, the story assembled itself visually on the canvas. Connections bloomed outward in sequential waves until all 130 color-coded nodes hung together like a glowing cosmic constellation. Gods, monsters, locations, songs, and actors were suddenly contextualized within a single, unified visual plane.
Phase 3: Discovering the "Island"
The celebration was short-lived. Upon stepping back to admire the completed visualization, Ojogbede noticed an alarming anomaly. Separated from the main body of the graph by a wide expanse of empty canvas sat an entirely isolated cluster of data points.

This standalone island featured Agamemnon, Menelaus, Helen of Troy, Clytemnestra, and their respective actors. While these nodes were properly connected to one another through internal relationships like MARRIED_TO, SIBLING_OF, and PLAYS, they possessed zero outgoing or incoming links to the rest of the epic.
Weeks of careful spreadsheet reading had failed to expose this massive structural disconnect. The Trojan War plotline had been completely severed from Odysseus’s journey, hidden entirely by the linear constraints of tabular data organization.
Phase 4: The Ten-Second Fix
Once visualized as a force-directed graph—where connected items pull toward one another and disconnected items drift apart—the missing context became glaringly obvious. Repairing the fracture required minimal effort. In Book 4 of Homer’s epic, Odysseus’s son Telemachus visits Menelaus in Sparta to seek news of his missing father.
To bridge the gap in the database, Ojogbede needed only three lines of intuitive Cypher code:

MATCH (t:Character name: "Telemachus")
MATCH (m:Character name: "Menelaus")
MERGE (t)-[:VISITS]->(m)
Running this query instantly snapped the isolated family cluster back into the broader narrative ecosystem. The graph had successfully diagnosed a structural plot hole in seconds—an issue that traditional tables had concealed for weeks.
Supporting Data: Comparing Tabular and Graph Methodologies
Ojogbede’s experiment highlights a fundamental truth in data science: different data structures are optimized for entirely different types of insights.
| Feature / Objective | Tabular Data (Spreadsheets / SQL Tables) | Graph Databases (Neo4j / Network Models) |
|---|---|---|
| Primary Unit | Rows and columns (entities and attributes) | Nodes and directed edges (entities and relationships) |
| Handling Connections | Relies on matching values or foreign keys; relationships lack independent existence | Stores relationships explicitly as physical arrows between nodes |
| Error Detection Strength | Excellent for finding value-based errors (e.g., incorrect counts, duplicate rows, empty cells, typos) | Superior for finding structural errors (e.g., missing links, isolated data islands, orphaned entities, misdirected paths) |
| Visual Diagnostic Value | Low; requires manual sorting, filtering, or pivot tables to spot anomalies | High; visual layout naturally clusters related items and distances unlinked entities |
As Ojogbede noted, spreadsheets excel when data needs to be audited for quantitative consistency. For instance, when an initial automated count returned 125 nodes instead of the expected 130, the discrepancy was immediately spotted by comparing the tabular totals. Tables are built for counting, comparing values, and identifying localized data corruption.
Conversely, graphs are built for topology. When a relationship is missing, there is no empty spreadsheet cell to flag the absence; the connection simply isn’t there. Only a graph database treats the relationship itself as a tangible object, allowing spatial visualization to immediately spotlight missing pathways, orphaned groups, or hidden fraud networks.

Official Responses and Expert Perspectives from the Field
The implications of Ojogbede’s work extend far beyond classical literature, resonating deeply within the broader data science and developer education communities. As a Technical Curriculum Developer at Neo4j’s GraphAcademy, Ojogbede regularly champions the integration of graph-based thinking into modern technical education.
Industry experts have long pointed out that real-world data is inherently relational. Whether mapping supply chains, tracking cybersecurity threats, or analyzing corporate governance, analysts frequently rely on tabular formats simply out of habit, inadvertently blinding themselves to structural vulnerabilities.
By utilizing accessible cloud tiers like Neo4j Aura and publishing her comprehensive dataset on GitHub, Ojogbede has provided an engaging, low-barrier entry point for developers and data enthusiasts to explore graph technology. Her project demonstrates that abstract computer science concepts—often perceived as dry or overly academic—can be effectively communicated through cultural touchstones, ranging from ancient heroic epics to viral TikTok musicals.
Broader Implications: Finding Your Own "Agamemnon"
The lessons learned from mapping The Odyssey carry profound takeaways for modern data practitioners across industries:

- The Danger of Silent Errors: Clean, well-formatted spreadsheets do not equate to structurally sound data. An entire sub-plot or operational department can be completely isolated from an enterprise database while every individual data row remains flawlessly accurate.
- The Power of Spatial Analytics: Visualization is not merely a final reporting step; it is an active diagnostic tool. Letting algorithms calculate distance based on connectivity allows human analysts to spot systemic gaps at a glance.
- Choosing the Right Tool for the Job: Data professionals must recognize the limitations of their preferred tools. Spreadsheets are exceptional ledgers, but when the core research question revolves around how things connect, a graph model is indispensable.
Ultimately, Kemi Elizabeth Ojogbede set out to resolve a lighthearted internet debate regarding a timeless Greek myth, only to return with a powerful debugging methodology. Her project serves as a timely reminder for data analysts everywhere: somewhere within your organization’s spreadsheets, an isolated "Agamemnon" is waiting to be discovered.
For those interested in exploring the project firsthand, the complete dataset, import scripts, and tutorials are publicly available via the GraphAcademy Blog and Kemi Elizabeth Ojogbede’s GitHub repository.
 Azzam Bilal Chamdy
 Asep Darmawan
 Suro Senen
