
 By Suro Senen
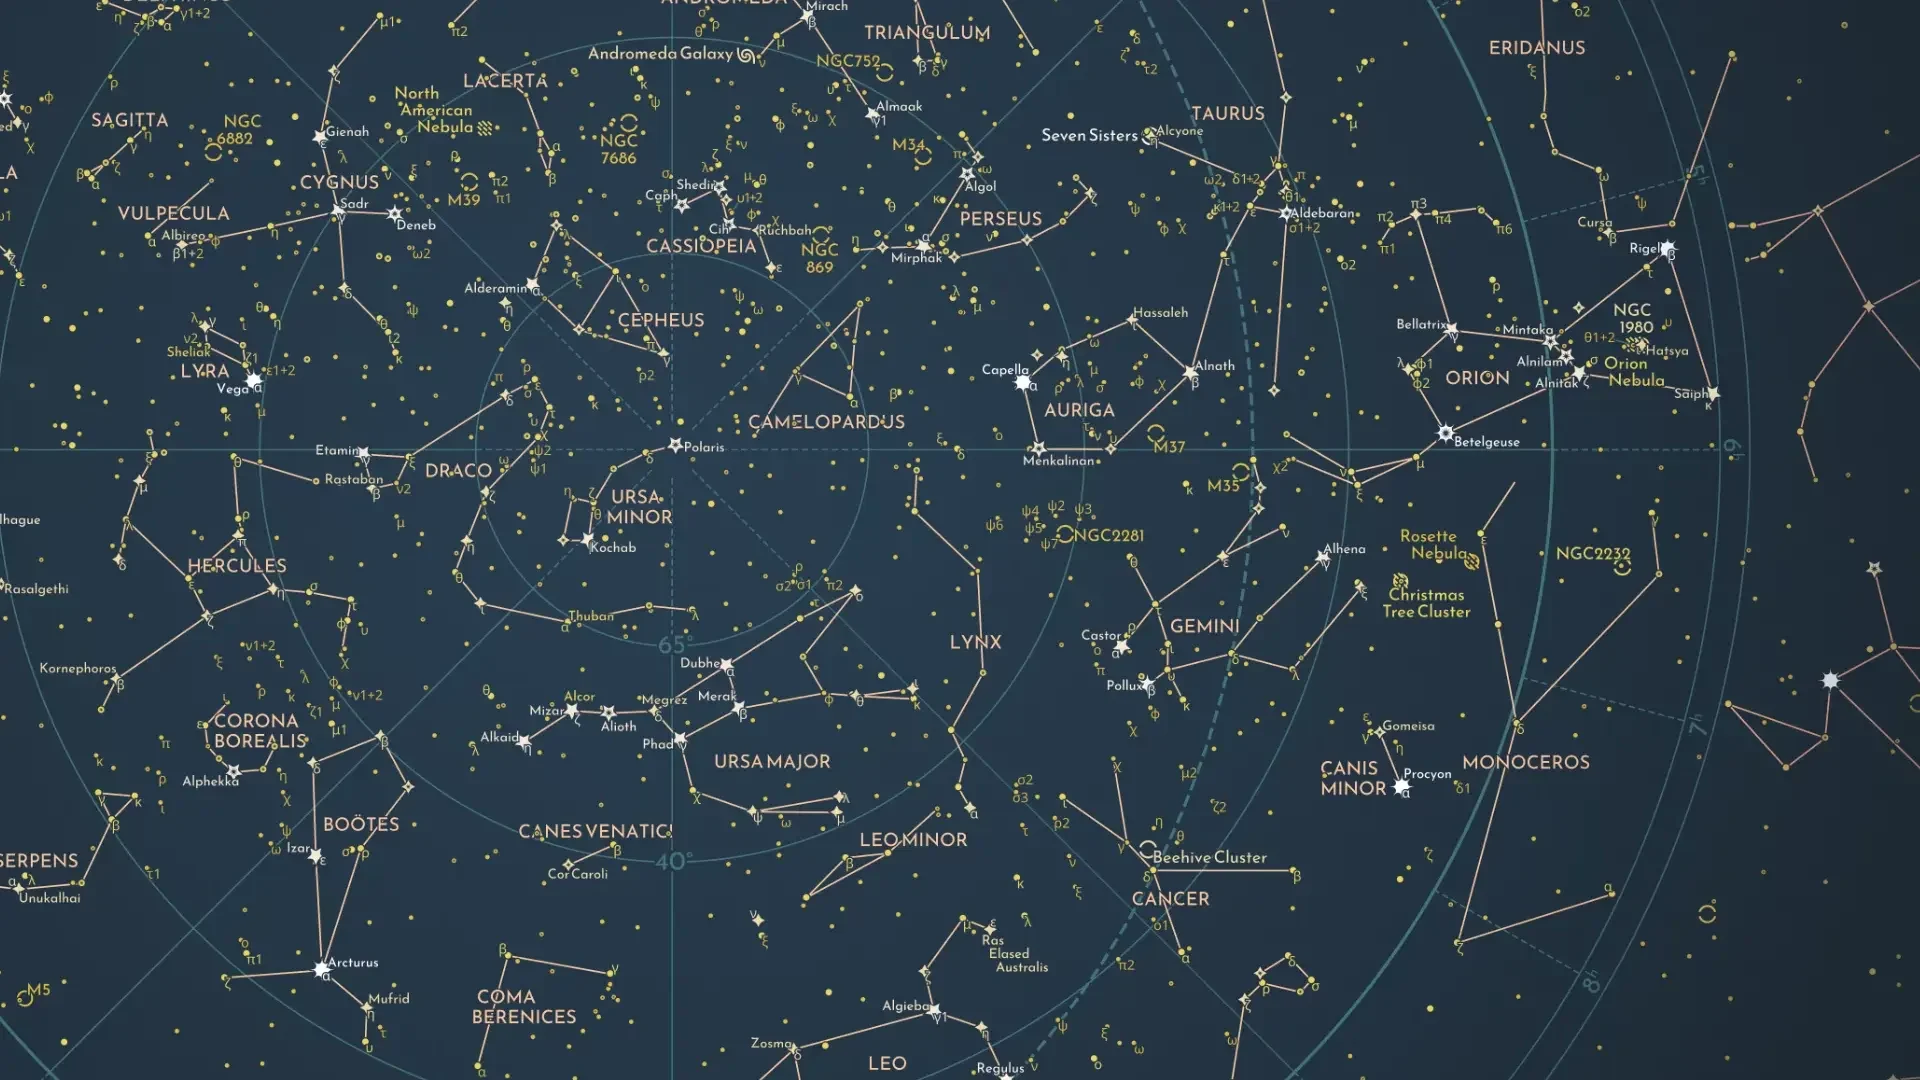
Long before the advent of Global Positioning Systems (GPS) or the intricate constellations of satellites that currently orbit our planet, humanity’s primary interface with the unknown was the night sky. For millennia, the stars served as more than just a source of wonder; they were the ultimate navigational charts, agricultural calendars, and repositories of cultural myth. Today, a new, meticulously crafted map by designer Florian Winkler serves as a bridge between this ancient tradition of celestial observation and the modern era of high-precision data science.
The Chronology of Celestial Mapping: From Wanderers to Data Points
The human obsession with the heavens is as old as consciousness itself. To understand the significance of modern mapping, one must first appreciate the evolutionary trajectory of astronomy.
The Era of "Planetes"
The ancient Greeks were among the first to formalize the study of the heavens. They identified the five visible planets—Mercury, Venus, Mars, Jupiter, and Saturn—not as stationary beacons, but as planetes, or "wanderers." Unlike the fixed stars that maintained their relative positions in predictable patterns, these bodies defied the rigid geometry of the night sky. This realization birthed the need for dynamic tracking systems.
The Age of Exploration and Celestial Navigation
As maritime travel expanded during the 15th through 18th centuries, the ability to read the stars became a matter of survival. Explorers like Vasco da Gama and James Cook relied on sextants and celestial navigation, measuring the angle between a star and the horizon to determine their latitude. These mental maps, translated onto parchment and vellum, were the most valuable assets of the Age of Discovery.
The Transition to Scientific Cataloging
As optical technology advanced—most notably with the invention of the telescope—the sheer volume of data surpassed the human capacity for simple memorization. The 19th and 20th centuries saw the birth of comprehensive catalogs. Astronomers began moving away from artistic renderings of constellations toward precise, coordinate-based systems, laying the groundwork for the modern databases that power today’s digital maps.
Supporting Data: The Anatomy of a Modern Map
Florian Winkler’s latest project represents the pinnacle of modern data visualization, synthesizing centuries of astronomical records into a single, cohesive visual experience. The project is not merely an artistic endeavor; it is a rigorous application of big data, drawing from three distinct pillars of astronomical research:
1. Stellarium: The Foundation of Virtual Observatories
Stellarium is widely recognized as one of the most accurate open-source planetarium software programs available. By utilizing its rendering engine, Winkler ensures that his map reflects the sky as it appears to an observer on Earth, accounting for atmospheric refraction and the specific geometry of the Northern Hemisphere.
2. The HYG Database: The Backbone of Stellar Positioning
The HYG Database—an acronym for Hipparcos, Yale Bright Star, and Gliese—is the "gold standard" for open-access star data. It combines the most precise measurements of stellar distance, brightness, and spectral type. By integrating this dataset, Winkler’s map offers more than just visual flair; it offers astronomical utility. Each star plotted is backed by rigorous coordinate data that defines its exact position in 3D space relative to our solar system.
3. W. H. Finlay’s Concise Catalog of Deep-sky Objects
While stars provide the framework, deep-sky objects—nebulae, galaxies, and star clusters—provide the depth. W. H. Finlay’s definitive work acts as the third leg of this analytical stool. By incorporating these objects, the map shifts from a simple star chart to a comprehensive guide of the Northern Hemisphere’s celestial architecture.
The Convergence of Art and Astronomy
The beauty of Winkler’s map lies in its "human-centric" design. While modern telescopes like the James Webb Space Telescope provide data that is increasingly abstract and invisible to the naked eye, Winkler’s work restores the perspective of the ground-based observer.
"We have lost touch with the night sky," notes one analyst of the project. "By synthesizing data that would take a lifetime for a single human to verify, Winkler has created a map that feels both ancient in its aesthetic and futuristic in its precision."
The map serves as a vital reminder that our reliance on technology has not diminished our need for spatial literacy. Whether one is a seasoned astrophysicist or a casual stargazer, the ability to interpret the night sky remains a fundamental human skill.
Official Responses and Expert Commentary
The release of the map has garnered attention from both the data visualization community and the amateur astronomy circuit.
Dr. Elena Vance, a senior researcher in observational astronomy, commented on the project: "What Florian has done is effectively democratize complex astronomical data. Often, these catalogs are locked behind professional interfaces. By surfacing this data in an accessible, aesthetic format, he is encouraging a new generation to look up. It is a synthesis of art and hard science that we rarely see executed with this level of fidelity."
In the field of data design, critics have lauded the map for its clarity. The challenge of representing a spherical sky on a two-dimensional surface is a classic problem in cartography, known as the "projection distortion" issue. Winkler’s approach, which prioritizes the accurate placement of deep-sky objects alongside the primary stars, demonstrates a sophisticated understanding of spherical geometry and data layering.
Implications for the Future of Observation
The implications of such a project are far-reaching. As light pollution continues to obscure the night sky for over 80% of the global population, the role of digital maps is shifting.
A Preservation Tool
For those living in urban centers where the stars are no longer visible, these maps act as a digital archive. They preserve the night sky in its most pristine state, ensuring that the knowledge of constellations—and the history embedded within them—is not lost to future generations.
Educational Advancements
Educational institutions are increasingly looking to interactive, data-driven mapping tools to replace static textbook illustrations. The integration of HYG data into user-friendly platforms allows students to simulate the movement of the stars over time, fostering a deeper understanding of orbital mechanics and stellar life cycles.
The Intersection of AI and Astronomy
Looking forward, the methodology used by creators like Winkler provides a template for future AI-driven sky mapping. As machine learning models gain the ability to process vast quantities of celestial data, we can expect to see real-time, interactive maps that update with every discovery of an exoplanet or a transient astronomical event.
Conclusion: The Sky as a Living Record
The history of mapping the heavens is, in essence, the history of human progress. From the "wanderers" observed by the Greeks to the digitized, data-backed star charts of the 21st century, our drive to categorize the stars has been a drive to understand our place in the universe.
Florian Winkler’s map is more than just a piece of graphic design; it is a synthesis of the effort of thousands of astronomers, mathematicians, and explorers. It reminds us that while we may now rely on GPS to navigate our streets, we still look to the stars to navigate our purpose. In a world that is increasingly focused on the digital horizon, this map invites us to keep our eyes fixed on the eternal, infinite map above—a reminder that the most significant data we have is the light that has been traveling toward us for millions of years.
As we continue to push the boundaries of space exploration, the ability to orient ourselves within the vastness of the Northern Hemisphere’s celestial sphere remains a vital tether to our history. Whether used as a decorative piece or an educational tool, this map stands as a testament to the fact that when we map the stars, we are, ultimately, mapping ourselves.
 Sagoh
 Pevita Pearce
 Layla Zulfa
