
 By Laily UPN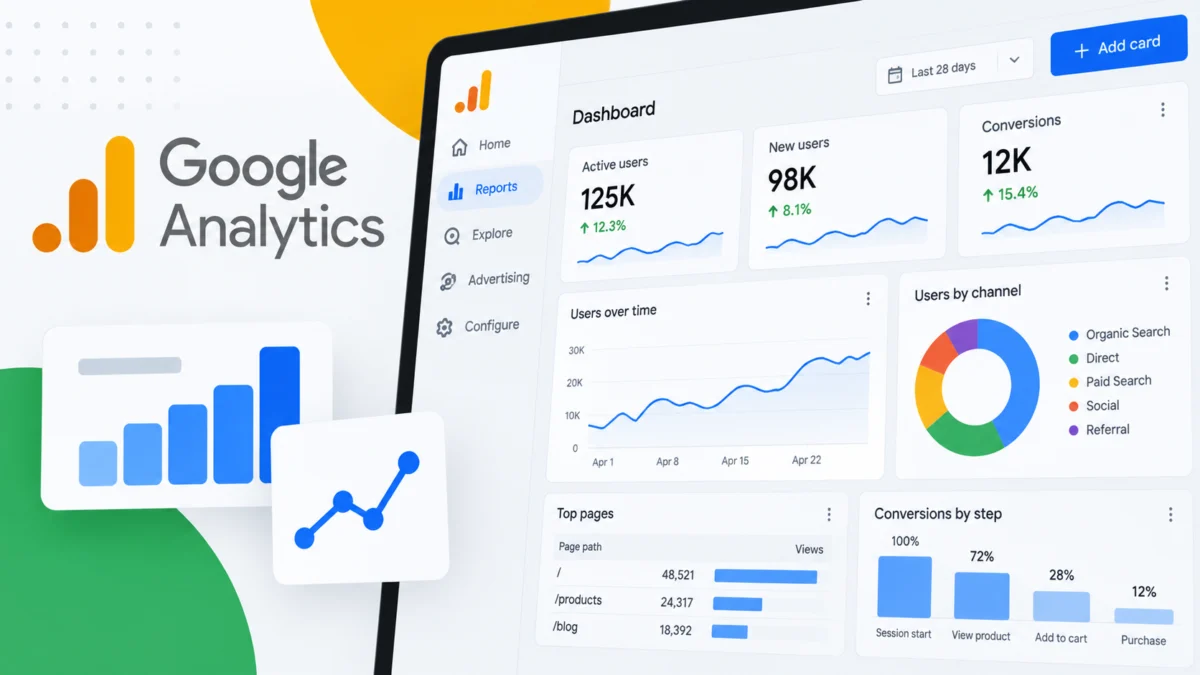
By Search Engine Land Reporting Desk
Google Analytics has rolled out a major update designed to streamline how businesses monitor their key performance indicators (KPIs). The platform has officially launched Dashboards, a native feature that allows organizations to consolidate their most critical metrics, visualizations, and insights onto a single, highly customizable report canvas.
By bridging the gap between raw data collection and digestible executive reporting, this release eliminates the friction traditionally associated with navigating multiple reports. Marketers, data analysts, and business owners can now design bespoke, centralized views of their data directly inside Google Analytics (GA), marking a significant step forward in usability and workflow efficiency.
Main Facts: What Are Google Analytics Dashboards?
The newly introduced Dashboards feature shifts Google Analytics from a fragmented report-retrieval tool into an integrated reporting workspace. At its core, the update introduces a grid-based canvas where users can build, arrange, and resize visual data elements using a simple drag-and-drop interface.
Key Functional Highlights:
- Drag-and-Drop Canvas: Users can drag dimensions and metrics directly onto a flexible grid to instantly generate and customize visual charts, bypassing the need to configure separate reports individually.
- Six Initial Visualization Types: To support diverse reporting needs, Google has launched with six distinct visual formats:
- Scorecards for high-level KPIs (supporting percentage changes during date comparisons).
- Tables for granular, multi-dimensional data reporting.
- Line Charts for tracking trends over time (supporting daily, weekly, and monthly views).
- Bar Charts for straightforward comparative analysis.
- Donut Charts for visualizing categorical breakdowns.
- Funnel Charts for monitoring user conversion steps and drop-off points.
- Direct Navigation Publishing: Completed dashboards can be published directly to the "Reports" left-hand navigation menu, bypassing the Google Analytics library and making them immediately accessible to stakeholders across the property.
Chronology and Rollout Details
The introduction of Dashboards addresses long-standing user feedback regarding the rigidity of Google Analytics 4 (GA4) reporting interfaces. Since the deprecation of Universal Analytics, marketers have frequently voiced the need for more flexible, customizable single-page reporting environments that do not strictly require exporting data to Looker Studio (formerly Google Data Studio).
- Development and Testing: Google quietly iterated on reporting customization options throughout late 2025 and early 2026, leading up to the September 2026 official launch.
- Current Availability: The feature is rolling out globally to all standard and premium Google Analytics properties.
- Permission Structures: Access is role-dependent. Users must hold an Editor or Administrator role to create, edit, and publish dashboards. However, once a dashboard is published to the navigation bar, anyone with standard viewing access to the GA property can view it.
Supporting Data, Capabilities, and Technical Limits
While the introduction of Dashboards brings powerful new visualization capabilities to GA, Google has implemented distinct technical parameters and limitations for the initial launch version.
Capacity and Property Limits
The complexity and size of a dashboard depend heavily on the tier of the Google Analytics property being utilized:

- Standard Properties: Permitted up to 15 cards per dashboard.
- Premium (GA360) Properties: Expanded capacity supporting up to 30 cards per dashboard.
Sharing and Collaboration Mechanics
Unlike ad-hoc explorations that can remain private to individual users, published dashboards are shared globally across the entire GA property. This ensures consistency across teams, as all departments view the exact same centralized performance snapshots.
Current Feature Limitations
As part of the initial launch phase, certain advanced analytical features are not yet supported:
- API Support: Programmatic access and extraction via the Google Analytics API are currently unavailable for these dashboards.
- Segments: Advanced segmentation layers cannot yet be applied directly as card-level filters within the dashboard canvas.
- Card-Level Comparisons: Complex multi-dimensional comparisons at the individual card level are restricted in this initial release.
Official Responses and Platform Intent
Google’s design philosophy behind the Dashboards update centers on reducing "tool fatigue" and accelerating the path from data discovery to actionable insight.
Industry analysts and Google product advocates note that modern digital marketing teams are often overwhelmed by data silos. By bringing dashboard creation natively into the platform, Google aims to keep users within the GA ecosystem rather than forcing them to build external dashboards or constantly toggle between disparate sub-reports.
"Marketers can now consolidate reporting inside GA," notes the platform documentation. "Instead of jumping between multiple reports to monitor performance, businesses can build a single-page view of the metrics that matter most to them."
The update underscores Google’s broader strategy to make GA4 more adaptable to enterprise workflows, catering to executive stakeholders who require high-level summaries alongside marketing practitioners who drill down into daily campaign metrics.
Implications for Marketers and Digital Agencies
The arrival of native dashboards has immediate operational implications for in-house marketing teams, agencies, and digital consultants.

1. Accelerated Routine Performance Monitoring
For teams tracking KPIs across multiple channels—such as organic search, paid media, email, and social traffic—daily check-ins can become time-consuming. By compiling key performance indicators (revenue, conversion rates, user acquisition costs, and traffic spikes) onto a single screen, routine audits become significantly faster.
2. Streamlining Client and Stakeholder Reporting
While external tools like Looker Studio will remain vital for multi-source data blending (e.g., combining GA4 data with CRM platforms, Facebook Ads, and SEO crawlers), internal stakeholders who only care about web performance can now be directed straight to a customized GA dashboard. This reduces the friction of onboarding non-technical team members into complex GA4 report libraries.
3. Democratizing Data Access Within Organizations
Because published dashboards live directly inside the primary navigation panel, cross-functional teams—from content creators to executive leadership—gain frictionless access to curated insights. This organizational transparency supports data-driven decision-making across departments without requiring every employee to master the complexities of custom report building.
Bottom Line
The launch of Google Analytics Dashboards represents a welcome and practical evolution for GA4 users. By introducing a flexible, grid-based, drag-and-drop workspace equipped with six essential visualization types, Google has simplified how businesses interact with their core metrics.
While certain limitations regarding API support and segmentation remain at launch, the ability to rapidly centralize KPIs onto a single, published report page transforms Google Analytics from a mere data repository into a more agile, actionable daily workspace for modern digital organizations.
 Jia Lissa
  Nana Muazin
  Layla Zulfa