
 By Evan Lee Salim
By Bhavin Lathia
Published via Nightingale / Formula Dream Insights
Main Facts: The Illusion of Precision in Modern Data
Turn an abstract quantity into a physical distance, draw it faithfully to scale, and a number that nobody can truly feel instantly becomes a reality that anyone can see.
At the 2026 Hungarian Grand Prix, Formula 1 veteran Lewis Hamilton crossed the timing line in qualifying to secure second place on the grid. His deficit to pole position was a razor-thin 0.012 seconds. On the official world broadcast graphics, this flashed up as a terse “+0.012s” before vanishing into the ether.
Did that number evoke any genuine physical sensation? For most viewers, the answer is a flat no. Human cognition is not inherently wired to picture twelve thousandths of a second. It remains an abstract blip on a screen.
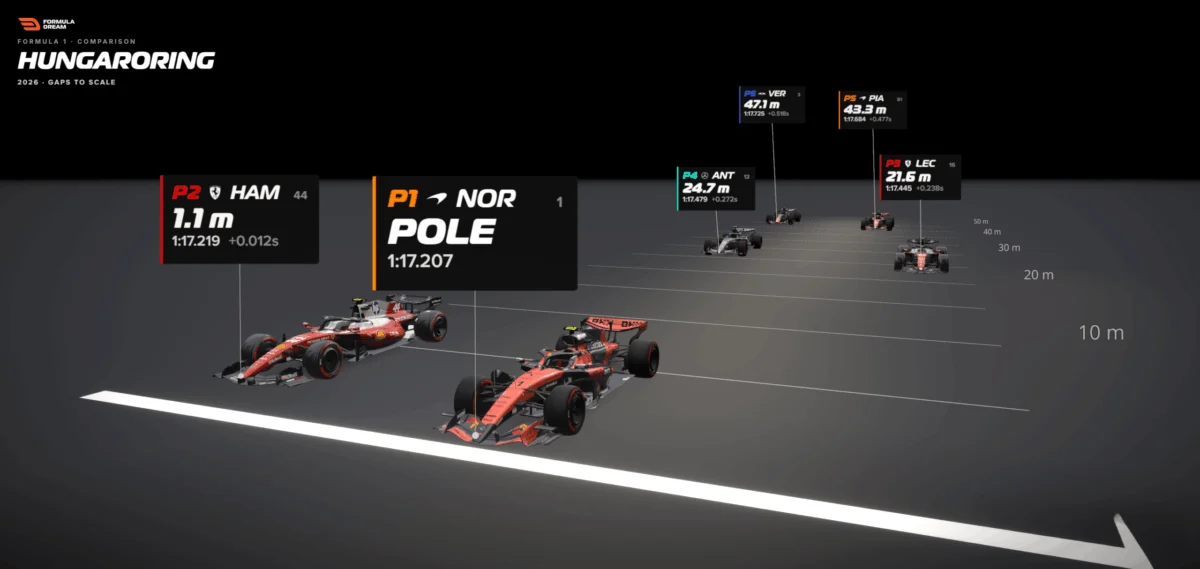
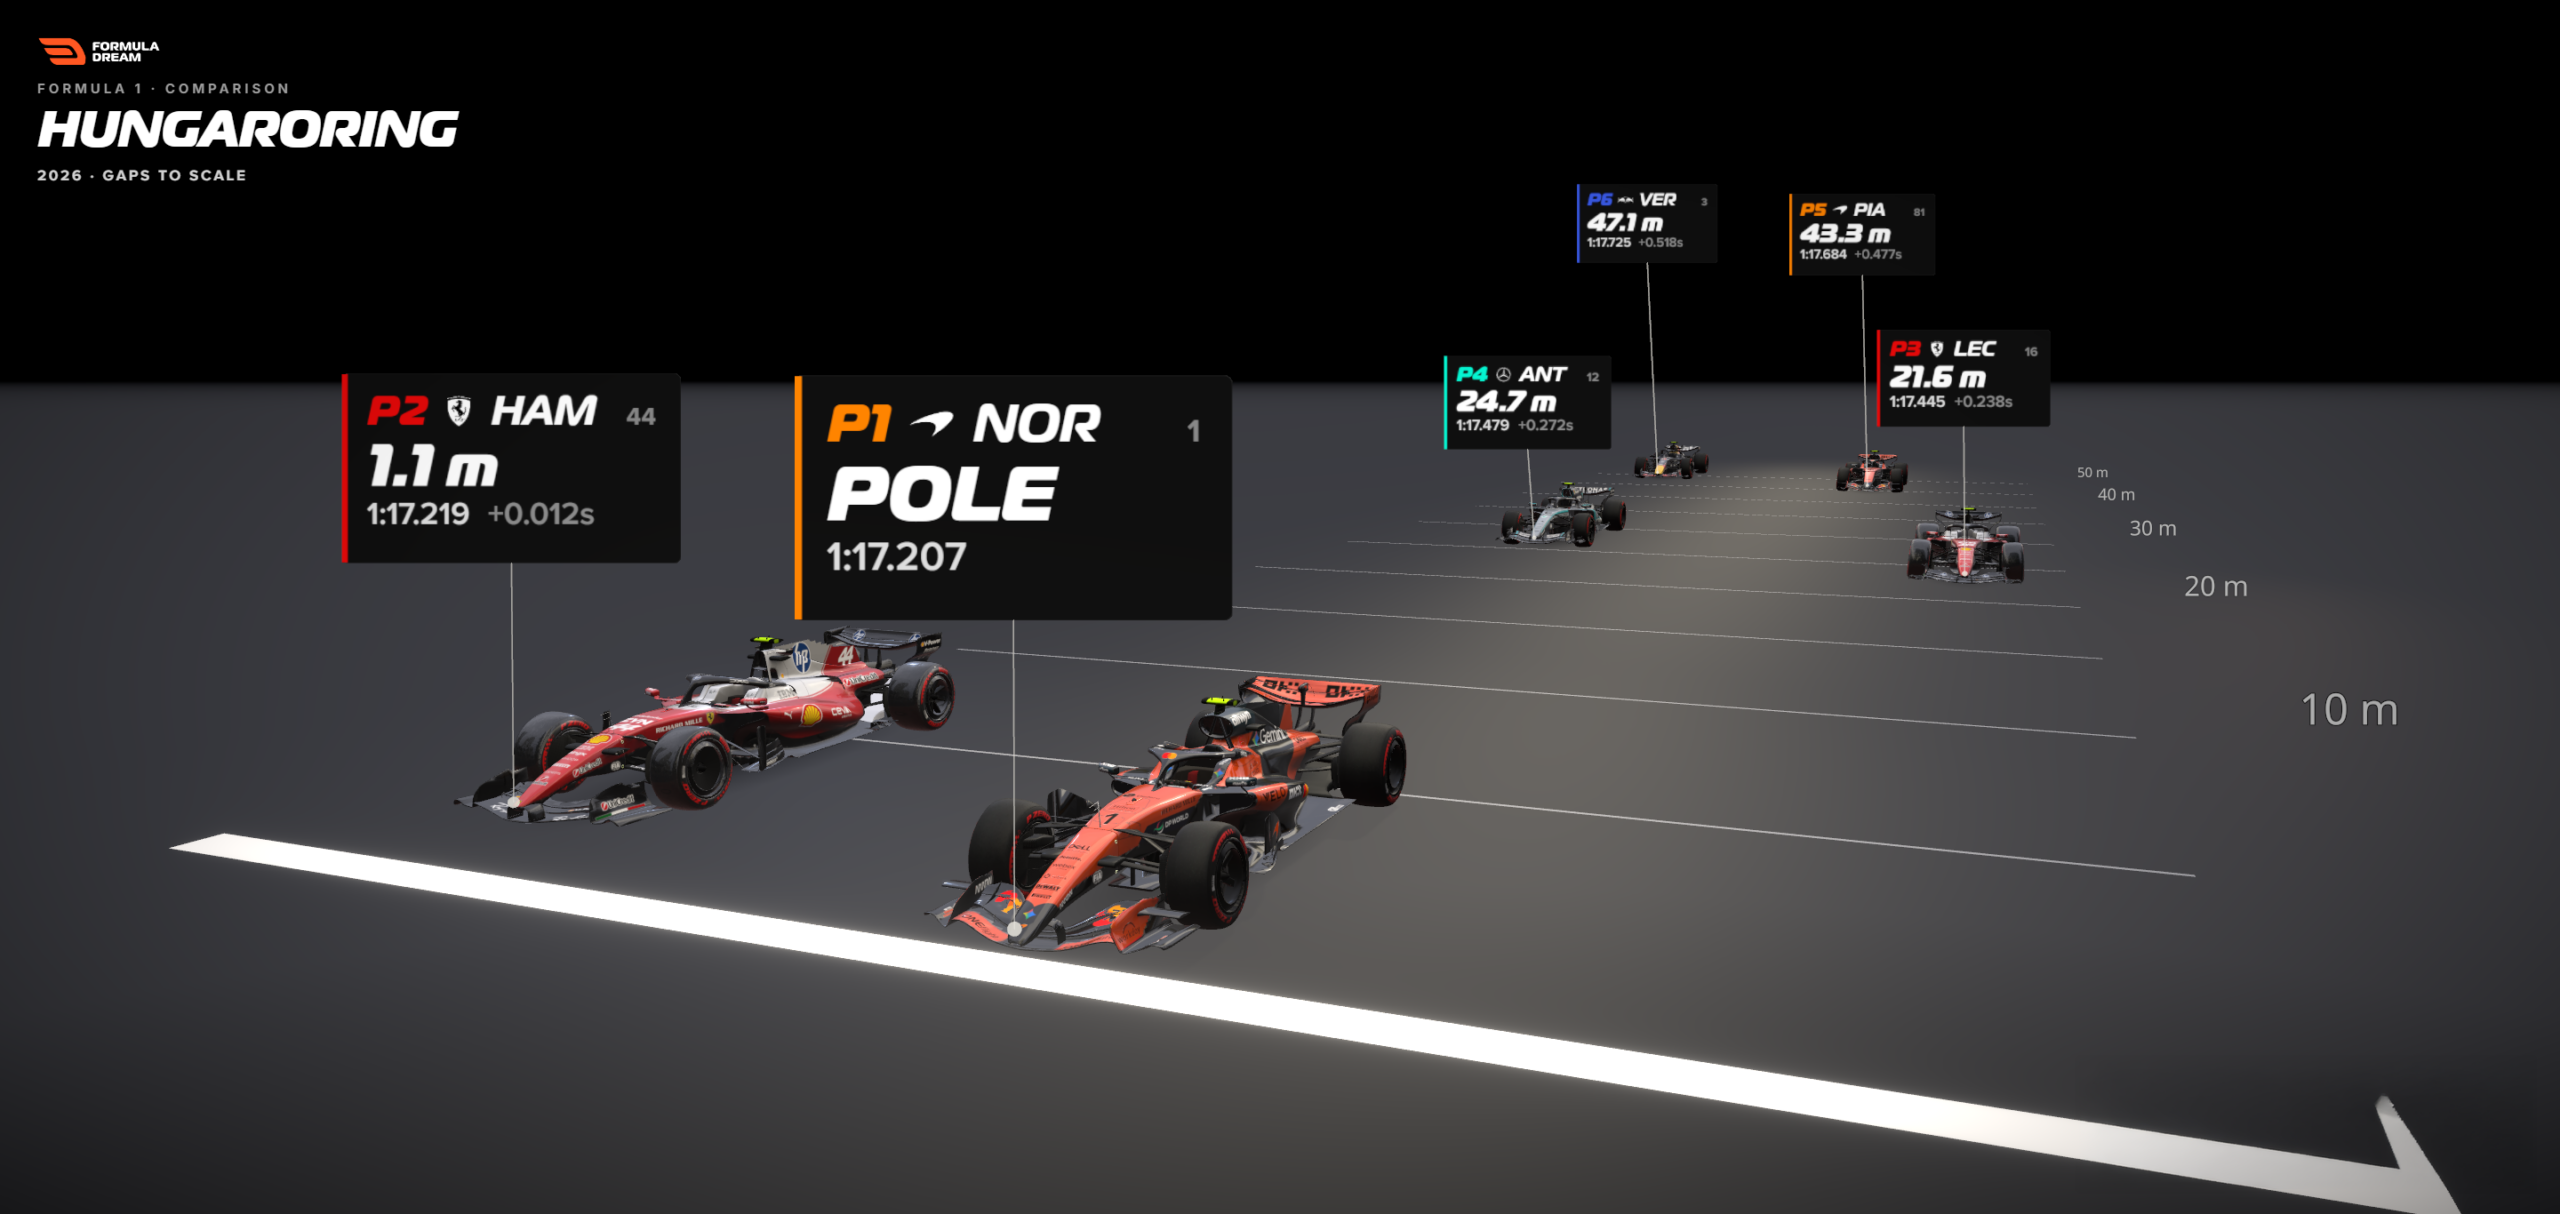
However, when translated into a different unit—distance—the narrative changes entirely. Hamilton was trailing pole position by a mere 1.1 metres. That is roughly the length of a single Formula 1 car’s nose cone. Suddenly, the sterile timing sheet comes to life. Readers can picture two multi-million-dollar racing machines tearing down the asphalt practically side-by-side, one desperately edging the other across the white start-finish line.
Nothing about the underlying statistical fact changed. Only the unit of measurement did. This chasm between a raw, unfeeling number and a visceral human comprehension is one of the most persistent hurdles in modern data visualisation. Fortunately, it has a wonderfully straightforward remedy: when a quantitative metric fails to land with an audience, stop trying to increase its decimal precision and start translating it into a physical dimension the reader’s body already understands. Usually, that dimension is distance.
Chronology: From the Timing Screen to the Track Layout
The evolution of how we perceive sporting gaps can be traced through a clear methodological progression. It begins with the raw data capture, moves through conventional analytical representations, and culminates in spatial, scale-conscious storytelling.
Phase 1: The Ephemeral Broadcast Flash
Modern sports data is captured with staggering fidelity. High-speed optical tracking systems, telemetry loops embedded in the tarmac, and transponders on every car measure intervals down to the thousandth of a second. Yet, this hyper-precision often works against human intuition. When qualifying sessions conclude, fans are routinely greeted with a vertical list of drivers and time deltas (+0.012s, +0.238s, +0.518s). While mathematically accurate, these figures exist in a cognitive vacuum.
Phase 2: The Traditional Bar Chart Approach
When data visualisers attempt to make these numbers digestible, the default instinct is to construct a bar chart. Plotting the gap-to-pole metrics horizontally for positions two through six provides an honest, clear ranking. It successfully demonstrates to the viewer that the performance gap back to sixth place is significantly wider than the minuscule gap separating pole from second.
Yet, looking at a conventional bar chart reveals its inherent limitations. Hamilton’s tiny sliver and Max Verstappen’s longer bar are merely geometric lengths on a flat page. While viewers can deduce that sixth place was further back, they cannot feel the magnitude of that separation. A standard bar chart answers the question of "how much slower?" but it remains entirely oblivious to "how far away?" A bar, after all, is not a place.
Phase 3: Spatial Translation on the Track
By taking those exact same qualifying deltas and projecting them onto a scaled illustration of a racing straight, the data undergoes a metamorphosis. Using a master reference speed, each car is set back from the starting line according to its converted metre distance.
Suddenly, the numbers acquire mass and context. Hamilton is no longer floating in numerical space; he is locked onto his rival’s gearbox, separated by a distance shorter than a typical living room. Drivers further down the order, compressed into a tight half-second window on the timing screens, are revealed to be strung out across nearly 50 metres of high-grip tarmac. The spatial emptiness does the heavy lifting, allowing human intuition to take over.
Supporting Data: The Mechanics of Time-to-Distance Conversion
Why are humans so poorly equipped to process temporal decimals while remaining exceptionally adept at evaluating physical space?
Cognitive psychologists note that humans have been calibrating distance, volume, and traversal time since early childhood—long before acquiring formal arithmetic skills. Asking an individual if 0.238 seconds is vastly greater than 0.012 seconds forces the brain to execute deliberate mental calculations. Conversely, asking whether 20 metres is significantly larger than one metre triggers an instantaneous, visceral, embodied response.

This psychological quirk explains why cartographers and data journalists lean on relatable proxies—such as describing a deforested region as "an area the size of Wales"—rather than throwing raw square kilometres at readers. It is also why urban transit maps that display walking times outperform those that merely count subway stops. The designer is not injecting novel information; they are handing the reader a mental grip they already know how to hold.
The Conversion Formula
Translating time gaps into physical spatial distance relies on a remarkably simple mathematical equation:
$$textDistance in metres = textGap in seconds times left( fractextSpeed in km/h3.6 right)$$
The rate variable is not an arbitrary guess; it is derived from empirical data. For Formula 1 qualifying sessions, data analysts extract the reference car’s measured speed through the official speed trap located near the start-finish line on its fastest lap.
During the Hungarian Grand Prix session in question, cars crossed the line screaming past at roughly 300 kilometres per hour—translating to approximately 83 metres per second. As a reliable rule of thumb, every tenth of a second equates to roughly eight metres of racing track at top speed. Multiplying Hamilton’s 0.012-second deficit by this velocity yields his precise 1.1-metre gap, while the broader top-six spread stretches out to 47 metres.
Official Responses and Methodological Transparency
Any rigorous data visualisation methodology must acknowledge its own structural limitations. A responsible visualist does not hide behind flashy UI tricks; they explicitly state what a model can and cannot claim to represent.
Data engineers behind interactive analytical tools—such as the open-source F1 Gap Visualizer developed by the Formula Dream project—stress that spatial track representations operate as controlled freeze-frames.

"What the visualization says is: If both cars were traveling at the reference car’s line speed simultaneously, this is how far back the trailing car would be at the exact instant the leader crosses the line," explains Bhavin Lathia, creator of the platform.
In reality, a qualifying gap accumulates over an entire circuit—through high-speed sweepers, heavy braking zones, and sluggish apexes. Mapping that cumulative time deficit entirely onto a straight-line speed trap is a deliberate abstraction. However, it is an honest one. Near the finish line, when cars are running completely flat-out, a single instantaneous speed metric is about as faithful to reality as numbers get. Applying that same uniform speed through slow, technical corners would distort reality, as the cars’ actual velocities would fluctuate wildly.
Furthermore, UI designers must implement minor visual accommodations for legibility. When plotting multiple cars along a single straight-line axis, vehicles are nudged slightly sideways. This lateral shift carries zero statistical weight; it exists solely to prevent icons from overlapping so that viewers can visually parse the grid. Only the longitudinal distance along the track carries analytical meaning. By openly communicating these parameters, visualisations earn the hard-fought trust of discerning readers.
Broader Implications: Moving Beyond Motorsport
While Formula 1 serves as an ideal sandbox for this technique due to its hyper-precise timing data and high-velocity contexts, the principle of time-to-distance mapping extends far beyond the racetrack.
Virtually any invisible, abstract unit can be mapped onto a tangible physical dimension that the human mind can instantly picture:
- Financial Data: Rather than quoting a national deficit in billions of dollars, express it as the literal weight of gold or the linear distance stacked one-dollar bills would stretch if laid end-to-end.
- Network Latency: Instead of highlighting a 50-millisecond server ping, visualize the physical speed of light racing through fiber-optic cables beneath the ocean floor.
- Environmental Metrics: Translate abstract carbon emissions volumes into cubic spaces, such as filling iconic urban architectural landmarks with greenhouse gases.
The structural pattern remains identical across all disciplines:
- Identify the conversion rate that translates an invisible metric into physical space.
- Render the data to scale wherever feasible.
- Allow the reader’s innate spatial intuition to supply the emotional and intellectual meaning.
Conclusion: Giving Data a Body
When a quantitative figure fails to resonate with an audience, the knee-jerk reaction among communicators is often to dial up the technical volume—adding extra decimal places, enlarging typography, or layering on complex percentage breakdowns.

The smarter path is precisely the opposite. Data journalists and visualization specialists must ask themselves: What physical reality is this abstract quantity truly equivalent to?
One hundredth of a second is fundamentally nothing to the human brain. A racing car’s nose cone hovering inches away from a rival’s gearbox is something concrete, vivid, and undeniable. The underlying data remains completely unchanged; the creator has simply given it a body.
The next time an important number refuses to land with an audience, bypass the spreadsheets and the standard charts. Give it a distance.
 Azzam Bilal Chamdy
 Asep Darmawan
 Suro Senen
