
“Daddy, what exactly do you do all day?”
“Mom, look at those beautiful pictures! Can I make some just like them?”

These questions, familiar to every parent working in the technical or analytical sectors, often lead to a stumbling block. How do you explain the abstract, logic-driven world of data visualization to a child? For Alex Kolokolov and Natalia Kiseleva, this wasn’t just a hurdle—it was the spark for an ambitious creative project that has evolved from a simple bedtime concept into a global initiative known as Data2Kids.
In an era defined by information, the ability to interpret data is becoming as fundamental as literacy. Recognizing this, Kolokolov and Kiseleva set out to bridge the gap between complex professional practice and youthful curiosity, resulting in their newly released book, Christine and the Magic Charts.

The Genesis of an Idea: Bridging the Generational Gap
The inspiration for Christine and the Magic Charts was rooted in the desire to share professional passions with the next generation. Data visualization—a field characterized by the intersection of beauty, logic, and critical thinking—is often misunderstood by outsiders as merely "making spreadsheets."
"We wanted to give children valuable skills early on," says Kiseleva. "In a fast-changing world, the ability to work with and visualize data is not just an interesting hobby; it’s a vital tool for navigating reality."

The authors aimed to create more than just an educational manual. Their goal was to foster shared, precious memories, capturing that magical moment when a child looks at their parent’s work not with confusion, but with wonder. By personifying the charts and graphs that define the industry, they hoped to turn abstract concepts into relatable companions for young readers.
Chronology of Creation: From Sketchbook to Publication
The project’s development followed a rigorous, multi-stage creative process that spanned several years.

1. Character Development
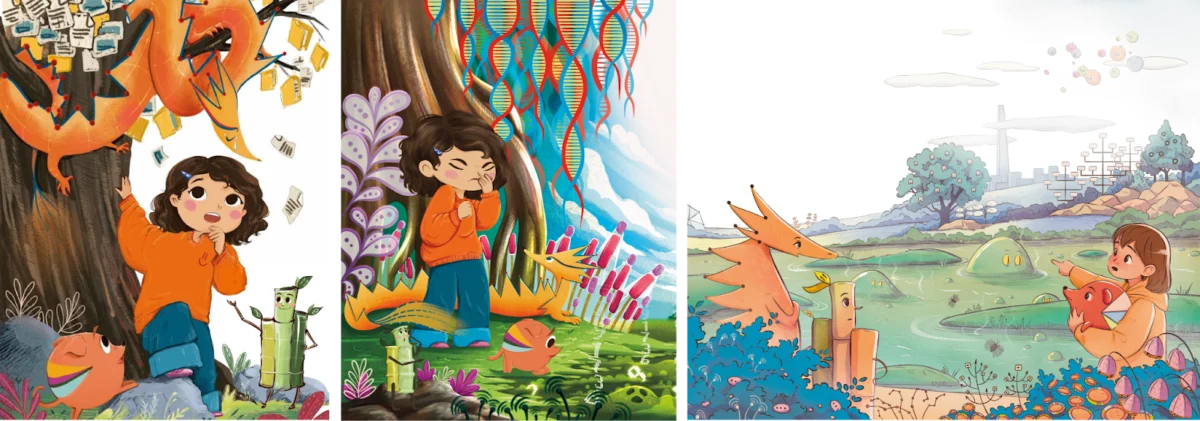
The initial hurdle was visual representation. The authors wanted to avoid overly clinical or "diagram-like" human figures. Instead, they opted for creature-based characters. The protagonist, Christine, was modeled after Kiseleva’s own daughter, Maya—a spirited, curly-haired girl with a love for adventure.
Perhaps the most critical character is Piechi, the pie chart creature. Recognizing that the pie chart is a polarizing figure in the data community, the authors leaned into its reputation. "Natalia imagined Piechi as a puppy that needs training—specifically, training not to ‘overeat’ by having too many slices," Kolokolov explains. This character serves as an allegory for the importance of proper data stewardship.

2. Weaving the Plot
Alex Kolokolov, leveraging his experience as a published author, spearheaded the narrative architecture. The story follows a classic, high-stakes journey: Christine ventures into a mysterious world of data to rescue her father, who has become "lost" within it.
Along the way, she encounters various chart-creatures, each possessing unique personalities and "dietary requirements." These interactions serve as narrative devices to teach children about the functional constraints and best practices of specific data tools, ensuring that the education is woven seamlessly into the adventure.

3. The Quest for Illustration
As the manuscript neared completion, the authors realized the magnitude of the artistic undertaking. While Kiseleva is an accomplished artist, the demands of book illustration required a specialized touch. After a global search for an illustrator who could balance technical accuracy with whimsical, child-friendly aesthetics, they partnered with Anastasiya Lykova. Lykova’s background as a parent herself proved vital, as she brought a soft, expressive quality to the characters that resonated deeply with the authors’ vision.
Supporting Data: Why Early Data Literacy Matters
The Data2Kids initiative is supported by a growing body of research suggesting that early exposure to data concepts significantly improves critical thinking. According to the authors, the project is designed to address three core competencies:

- Pattern Recognition: Helping children identify trends in their own daily lives.
- Information Literacy: Teaching the difference between clear, honest visualization and misleading charts.
- Logical Communication: Encouraging kids to articulate why they chose a specific chart to tell a story.
The "Chart Chooser" section included in the book acts as a reference guide, providing children with a tactile method for selecting the right tool for the right data, much like a professional BI analyst would do in a corporate setting.
Official Perspectives and Community Engagement
The project has moved beyond the printed page to become a vibrant ecosystem. The Data2Kids platform now hosts educational materials, merchandise, and a burgeoning community of "data-parents."

In a recent statement, the authors highlighted the importance of the community-driven aspect of the project: "We aren’t just selling a book; we are creating a space for parents and children to collect data together. Whether it’s tracking the weather, measuring the growth of house plants, or counting favorite toys, we want to make data a part of the family experience."
The authors are currently in the testing phase of a "little workbook," designed to provide hands-on, simple tasks that reinforce the concepts introduced in the main story.

Implications: The Future of Data Education
The launch of Christine and the Magic Charts coincides with the announcement of the Data Kids! international competition. This initiative invites children from across the globe to submit their own data visualization projects, with the winners receiving unique, hand-crafted prizes—including plush versions of the beloved Piechi character.
The implications for the field of data visualization are profound. By demystifying the industry, Kolokolov and Kiseleva are potentially shaping the next generation of data scientists, analysts, and informed citizens.

"If we can teach a child that a pie chart is a tool that requires balance and that data is a way to tell the truth about the world, we have succeeded," says Kiseleva. "The professional world is complex, but the language of data should be accessible to everyone, starting from the playroom."
Conclusion: A New Standard for Professional Advocacy
The journey of Christine and the Magic Charts is a testament to the power of creative storytelling in professional development. By stepping outside the confines of corporate dashboards and technical reports, Alex Kolokolov and Natalia Kiseleva have managed to humanize an often cold, mechanical field.

As they look toward the spring, the authors remain focused on their core mission: to provide more opportunities for shared activities between parents and children. With the book now available to the public, the "Data2Kids" project stands as a beacon for those who believe that the skills of the future—logic, analysis, and visual storytelling—should be nurtured with the same care and imagination as any other childhood talent.
For parents in the field, this is more than just a book; it is a bridge. It is an answer to the question, "What does Mom or Dad do at work?" and a gateway into a world where data is not just something to be processed, but something to be understood, explored, and ultimately, mastered.

About the Authors:
- Alex Kolokolov is a 15-year veteran of the business intelligence industry and founder of Data2Speak Inc. He is the author of several acclaimed books on dashboard design and has been a leading organizer for international data visualization conferences.
- Natalia Kiseleva is an engineer, BI analyst, and educator at prestigious institutions including the HSE and Moscow State University. As both a technical trainer and a professional comic artist, she brings a unique hybrid perspective to the art of data communication.
