
 By Nana Wu
Main Facts: The Illusion of Precision in Modern Data Visualization
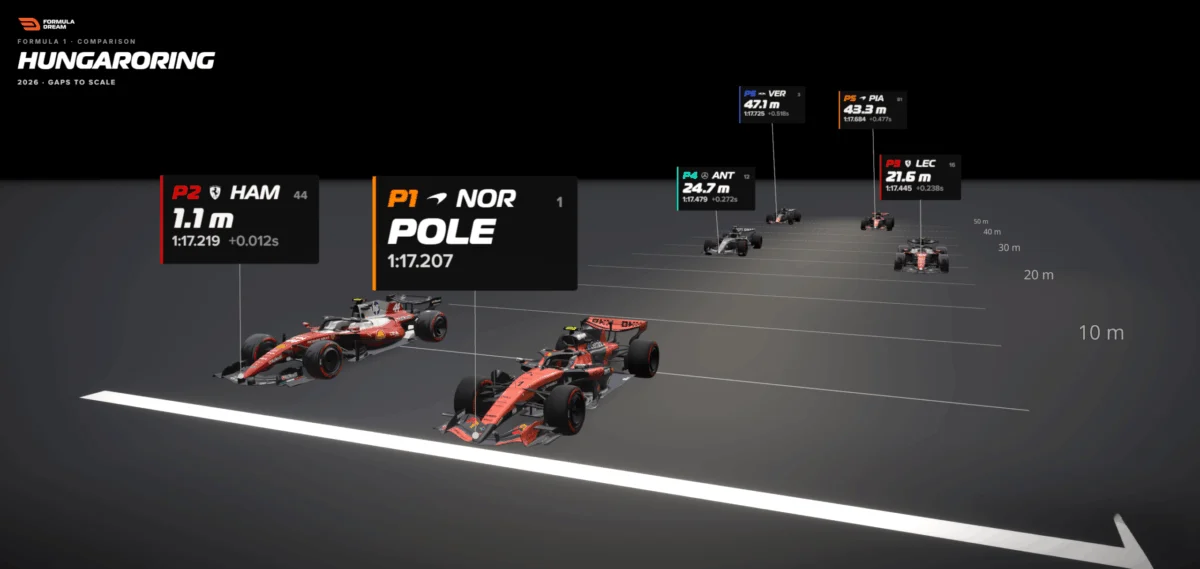
At the 2026 Hungarian Grand Prix, veteran driver Lewis Hamilton crossed the timing line during qualifying to lock in a blistering lap time, missing out on pole position by a razor-thin margin. On the global television broadcast, the graphics flashed a familiar, sterile metric: +0.012s.
For the average viewer, this number evaporates into the ether almost instantly. It triggers no visceral reaction, no instinctive gasp, and no genuine comprehension. Twelve thousandths of a second is an abstract quantity—a ghost in the machine. Human cognitive architecture is simply not engineered to feel fractions of a second when presented as raw numerical digits.
However, when that exact same data point is translated from an ephemeral temporal unit into a tangible, physical distance—revealing that Hamilton was trailing pole position by a mere 1.1 meters, roughly the length of a single Formula 1 car’s nosecone—the psychological reality shifts dramatically. Suddenly, viewers can picture two multi-million-dollar racing machines hurtling down the tarmac side-by-side, one barely edging the other out over the white line.
Nothing about the underlying telemetry changed. Only the unit of measurement did.
This perceptual gap—the vast chasm separating a cold number from a felt human experience—represents one of the most pervasive challenges in modern data visualization. According to data designers and sports analysts like Bhavin Lathia, creator of the interactive analytics platform Formula Dream, the solution is remarkably straightforward: when numerical quantities fail to land with an audience, designers must stop striving for hyper-precision and start translating abstract metrics into physical dimensions that the human body instinctively understands. Usually, that translation takes the form of distance.
Chronology: From the Broadcast Screen to the Drawing Board
To understand how data visualization experts are revolutionizing the way fans consume high-speed sports, it helps to trace the evolution of how gaps have historically been communicated in motorsports.
The Era of the Stopwatch (Pre-Digital Era)
For decades, motorsport timing relied on mechanical stopwatches and simple tabular displays. Fans and team pit walls alike were forced to reconcile with static differential columns: +0.2s, +1.5s, +12.3s. While functional for race strategists who lived and breathed lap-time deltas, these numbers remained largely impenetrable to casual viewers. The burden of translation fell entirely on the consumer, who had to mentally calculate what fractions of a second actually meant in terms of physical proximity on a racing circuit.
The Rise of Modern Graphics and the Bar Chart Revolution
As television broadcasts modernized, graphics departments introduced color-coded timing towers, mini-sectors, and eventually horizontal bar charts. These tools successfully ranked drivers by performance and showed magnitudes—allowing viewers to see at a glance that a half-second gap was significantly larger than a hundredth-second gap. Yet, traditional bar charts suffered from a fatal flaw: a bar is not a place. While a bar chart answers the analytical question of how much slower a driver was, it remains entirely blind to the spatial reality of how far back they actually sat on the asphalt.
The Spatial Turn: 2026 and Interactive Gap Visualizers
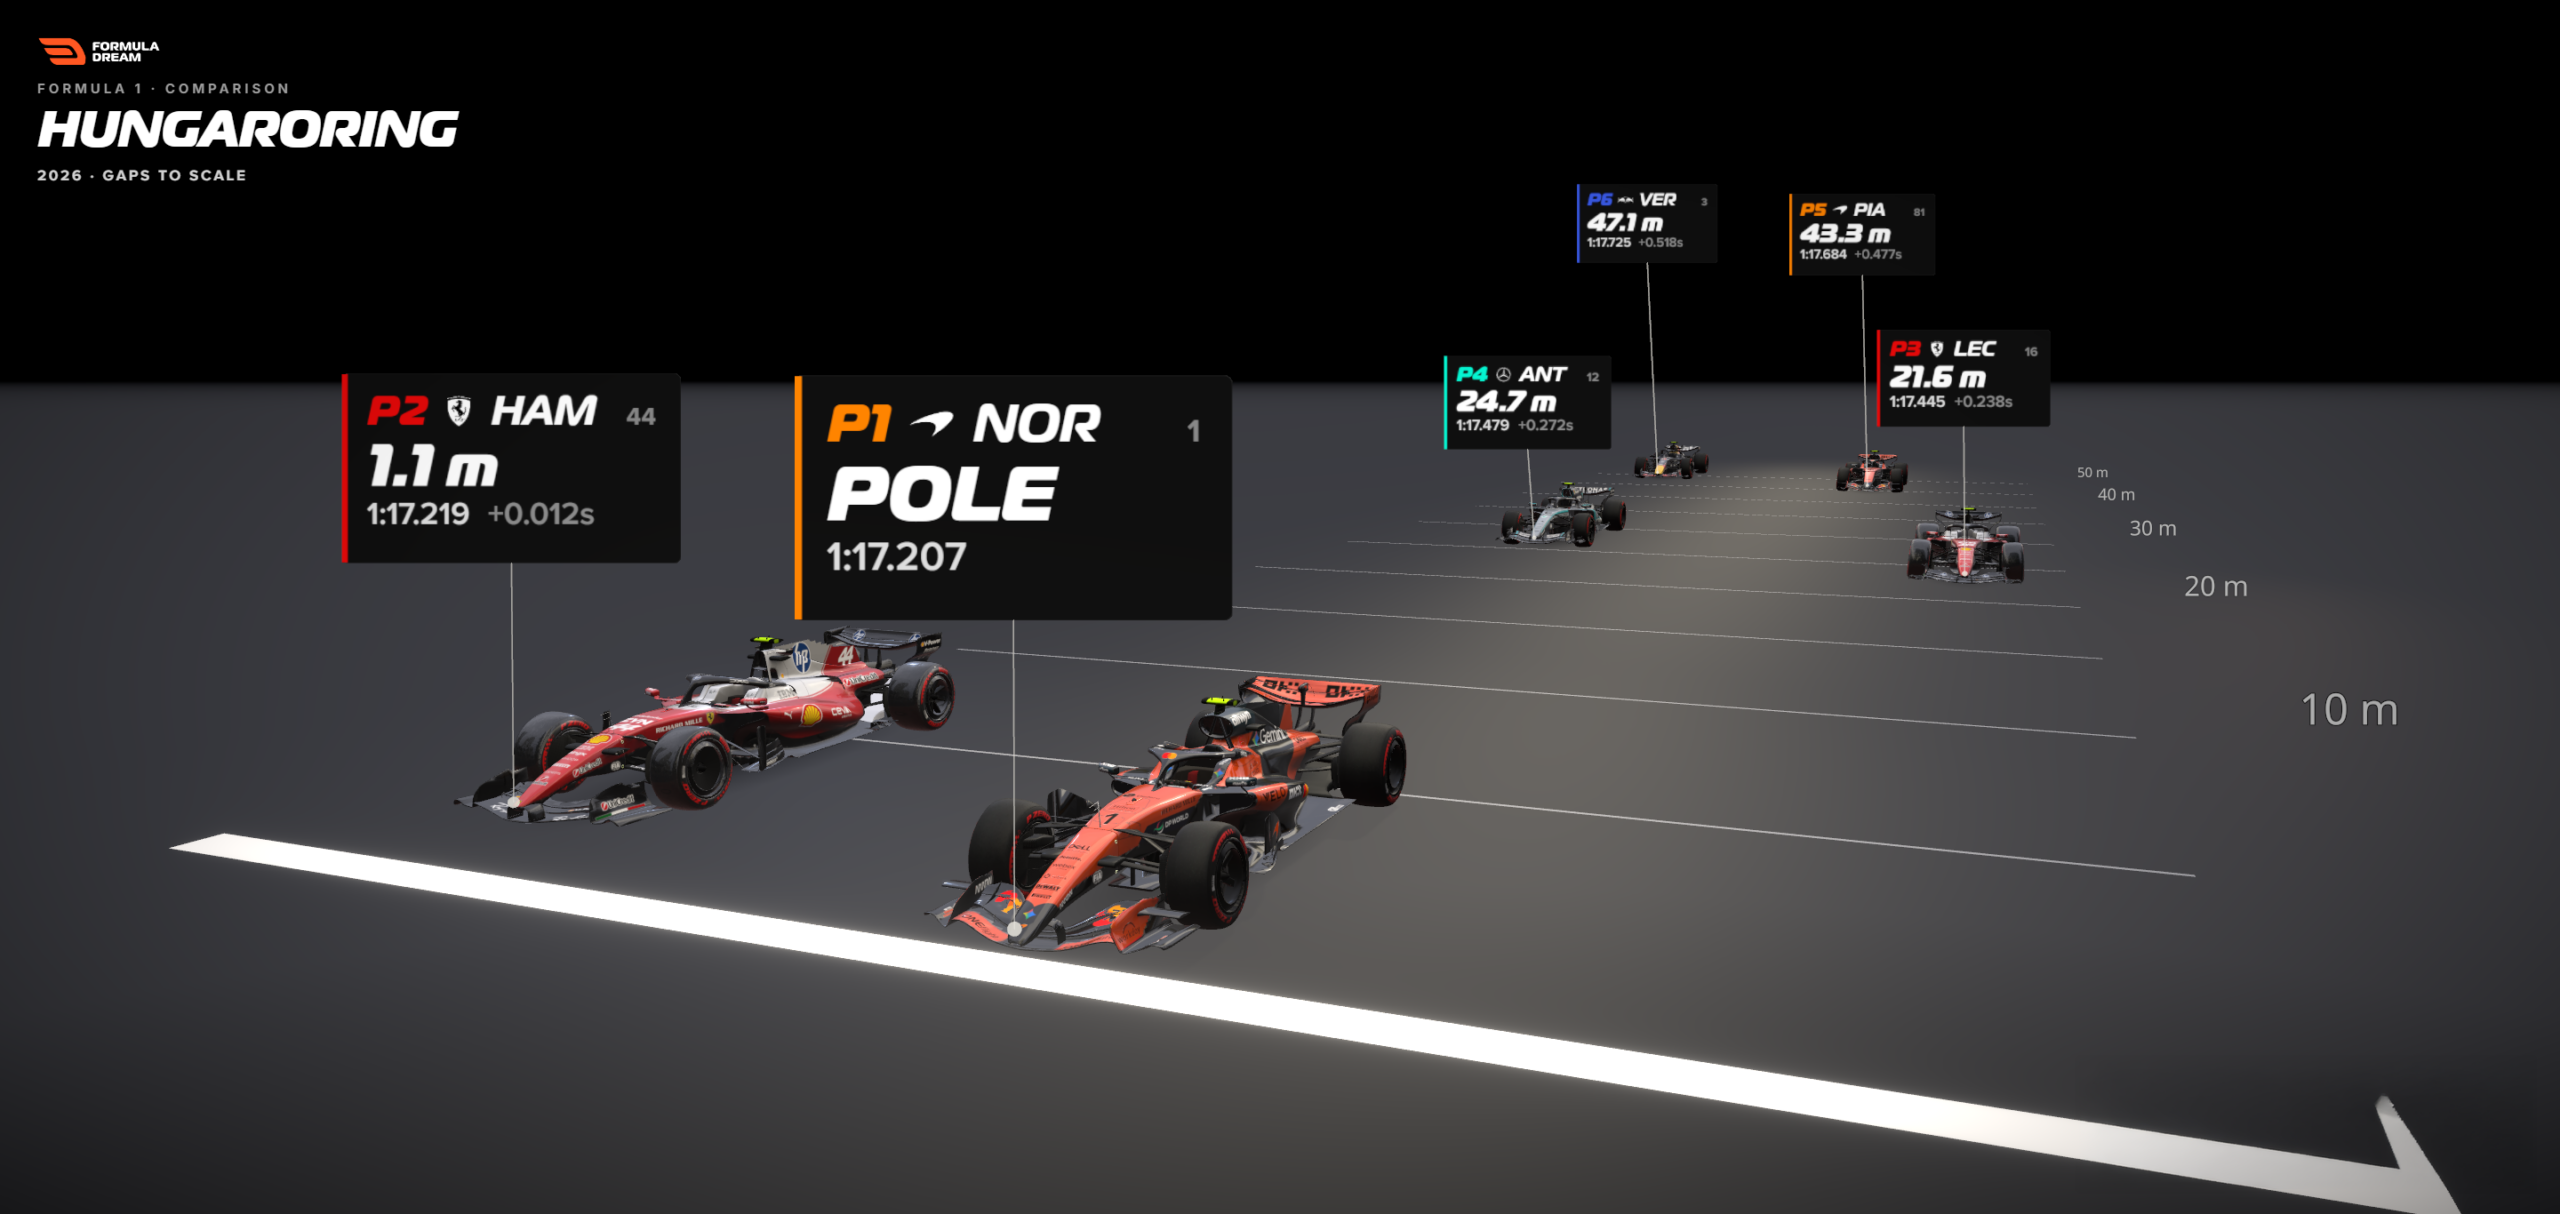
The paradigm shifted notably during the 2026 Formula 1 season, spearheaded by analytical tools such as the Formula Dream Gap Visualizer. By integrating precise speed telemetry with real-time positional mapping, designers began plotting qualifying gaps directly onto scale diagrams of the start-finish straight. Instead of displaying a floating decimal point, the interface rendered cars spaced apart in actual meters. This chronological leap moved sports data visualization away from purely numerical summaries and toward spatial storytelling, allowing fans to physically see the empty tarmac separating the grid.
Supporting Data: The Mathematics of Translation
The magic behind spatial data visualization is not rooted in complex algorithms, but in basic physics and a simple mathematical conversion.
The Core Formula
The methodology relies on a fundamental relationship between time, speed, and distance:
$$textDistance in meters = textGap in seconds times left( fractextSpeed in km/h3.6 right)$$

In the context of elite motorsport, the rate used to convert temporal units into spatial ones is the reference car’s line speed—the velocity clocked as the pole-sitter crosses the speed trap near the start-finish line during their fastest lap.
During the 2026 Hungarian Grand Prix qualifying session, the pole-sitter crossed the line travelling at roughly 300 kilometers per hour, translating to approximately 83 meters per second. As a general rule of thumb on an F1 straight, every tenth of a second equates to about 8 meters of tarmac.
Breaking Down the Grid
When applying this formula to the top six qualifiers at Budapest, the numbers transform from abstract decimal readouts into a striking physical procession:
- Lewis Hamilton (P2): Trailing by +0.012s, translating to 1.1 meters behind pole (virtually nose-to-gearbox).
- Intermediate Contenders (P3–P5): Spaced out progressively, with gaps stretching from a quarter-second to over half a second.
- The Cumulative Spread: While the timing screen showed the top six drivers covered by a seemingly tight half-second window, the spatial map revealed them strung out across nearly 50 meters of high-speed track.
This conversion exposes a profound truth: humans possess an innate, evolutionary calibration for space, distance, and traversal time. Ask anyone whether 20 meters is significantly further than one meter, and their intuition fires instantly. Ask them to mentally parse 0.238 seconds versus 0.012 seconds, and their brain is forced to execute manual arithmetic.
Official Responses & Expert Insights: Designing for Human Intuition
Data experts argue that the traditional adherence to raw, un-translated metrics represents a failure of empathy in interface design.
Bhavin Lathia, developer of Formula Dream, emphasizes that dense sports analytics must be restructured for audiences who may not possess advanced data literacy backgrounds.

"When a number isn’t landing, the instinct is often to add more decimal places, a larger font size, or a complicated percentage breakdown," Lathia notes. "We should try the exact opposite. Ask what physical equivalent your quantity possesses, and hand the reader that instead. A hundredth of a second is nothing. A car’s nose is something. The data didn’t change; you simply gave it a body."
Professional data visualization critics have echoed these sentiments across academic and industry forums, pointing out that effective visual communication relies heavily on leveraging pre-existing cognitive structures. When transit maps substitute station counts with walking times, or when environmental journalists describe deforestation using landmasses "the size of Wales," they are utilizing the exact same psychological mechanism: offloading cognitive load from abstract working memory onto embodied spatial awareness.
Implications: Beyond Motor Racing and into Universal Data Design
While sports analytics provide a pristine sandbox for testing spatial data translation, the underlying principles extend far beyond the world of Formula 1. The challenge of communicating invisible, abstract units plagues nearly every modern information sector.
Implications for Financial Literacy
In economics and personal finance, figures like national debt, inflation rates, or corporate profit margins frequently suffer from the same cognitive numbness as racing telemetry. Stating that a government program costs "$45 billion" fails to register with the human psyche. Translating that figure into physical or experiential equivalents—such as the cost per citizen in daily groceries or the linear distance those dollar bills would cover if laid end-to-end—bridges the gap between numeric scale and human comprehension.
Implications for Public Health and Climate Science
When communicating epidemiological infection rates or carbon emission thresholds (such as parts per million of atmospheric $CO_2$), public communication often stumbles because the metrics are entirely decoupled from physical reality. By converting abstract parts-per-million statistics into spatial density models or localized environmental impacts, science communicators can evoke immediate emotional and behavioral responses that raw statistics routinely fail to generate.
The Designer’s Honest Mandate
Translating abstract data into physical space does not mean abandoning methodological rigor. As Lathia points out when discussing the limitations of his F1 Gap Visualizer, transparency is vital. Acknowledging that a freeze-frame model assumes a uniform line speed across cars—or that slight visual offsets are introduced purely to prevent overlapping graphics—maintains the audience’s trust.

A great visualization does not hide its constraints; it clearly communicates its boundaries while maximizing the human brain’s natural capacity to understand the physical world.
Ultimately, the lesson for data designers across all disciplines is clear: whenever an audience struggles to connect with a metric, stop forcing them to memorize digits. Find the rate, map the space, and give the numbers a body.
 Azzam Bilal Chamdy
 Asep Darmawan
 Suro Senen
