
 By Nila Kartika Wati
Main Facts: The Intersection of Ancient Literature and Modern Data Science
In an era defined by internet subcultures, massive pop-culture fandoms, and the relentless generation of digital information, data visualization has increasingly become a bridge between the humanities and technical analysis. Kemi Elizabeth Ojogbede, a technical curriculum developer at Neo4j’s GraphAcademy, recently demonstrated this convergence in a striking project.
By mapping Homer’s 2,700-year-old epic poem, The Odyssey, alongside two of its most prominent contemporary adaptations—EPIC: The Musical (which famously sourced its cast via TikTok) and Christopher Nolan’s cinematic adaptation starring Matt Damon—Ojogbede constructed an expansive network graph containing 130 nodes and 235 distinct relationships.
While the project initially sought to settle lighthearted internet debates concerning narrative omissions and additions across the varying adaptations, it ultimately yielded a far more profound technical realization: certain data errors are entirely invisible until information is modeled as a graph rather than a table.
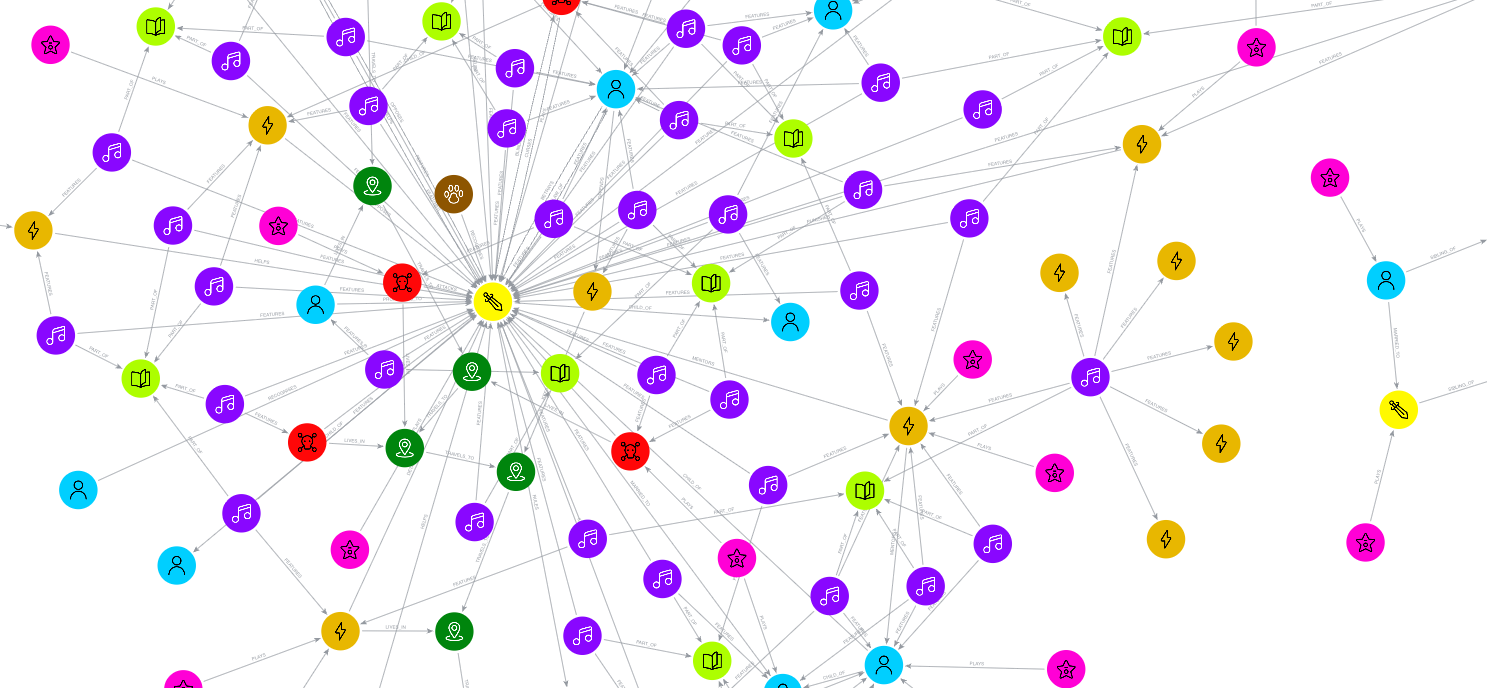
While traditional spreadsheets and CSV files excel at verifying discrete attributes, totals, and cell values, they fundamentally fail to reveal structural disconnections. Through force-directed graph layouts, Ojogbede discovered that data gaps do not look like broken rows or error codes; instead, they manifest as physical distance across a canvas.
Chronology: From the Spreadsheet Phase to the Constellation
The project’s lifecycle progressed through distinct methodological phases, highlighting the transition from traditional data storage to graph-based modeling.
Phase 1: Data Acquisition and the Spreadsheet Illusion
Driven by a desire to bring empirical rigor to internet discourse surrounding Odysseus, his adversaries, and his allies, Ojogbede spent her evenings manually compiling a dataset. Working primarily from Emily Wilson’s acclaimed translation of The Odyssey and cross-referencing it with the official cast lists of the modern film and musical adaptations, she built two CSV files:

- The Entities File: Cataloging 130 individual nodes, including heroes, deities, monsters, mortals, geographical locations, musical tracks, and actors.
- The Relationships File: Containing 235 rows mapping interactions, structured as grammatical sentences (
NOUN → VERB → NOUN), such asOdysseus -> BLINDS -> PolyphemusorPoseidon -> OPPOSES -> Odysseus.
Upon initial review, the spreadsheet appeared immaculate. The columns were tidy, naming conventions were consistent, and a random sampling of individual rows confirmed that every recorded fact was accurate. However, this accuracy formed a deceptive trap: every individual row was true, yet the structural validity of the dataset as a cohesive narrative was entirely compromised.
Phase 2: Graph Assembly and the Discovery of the "Island"
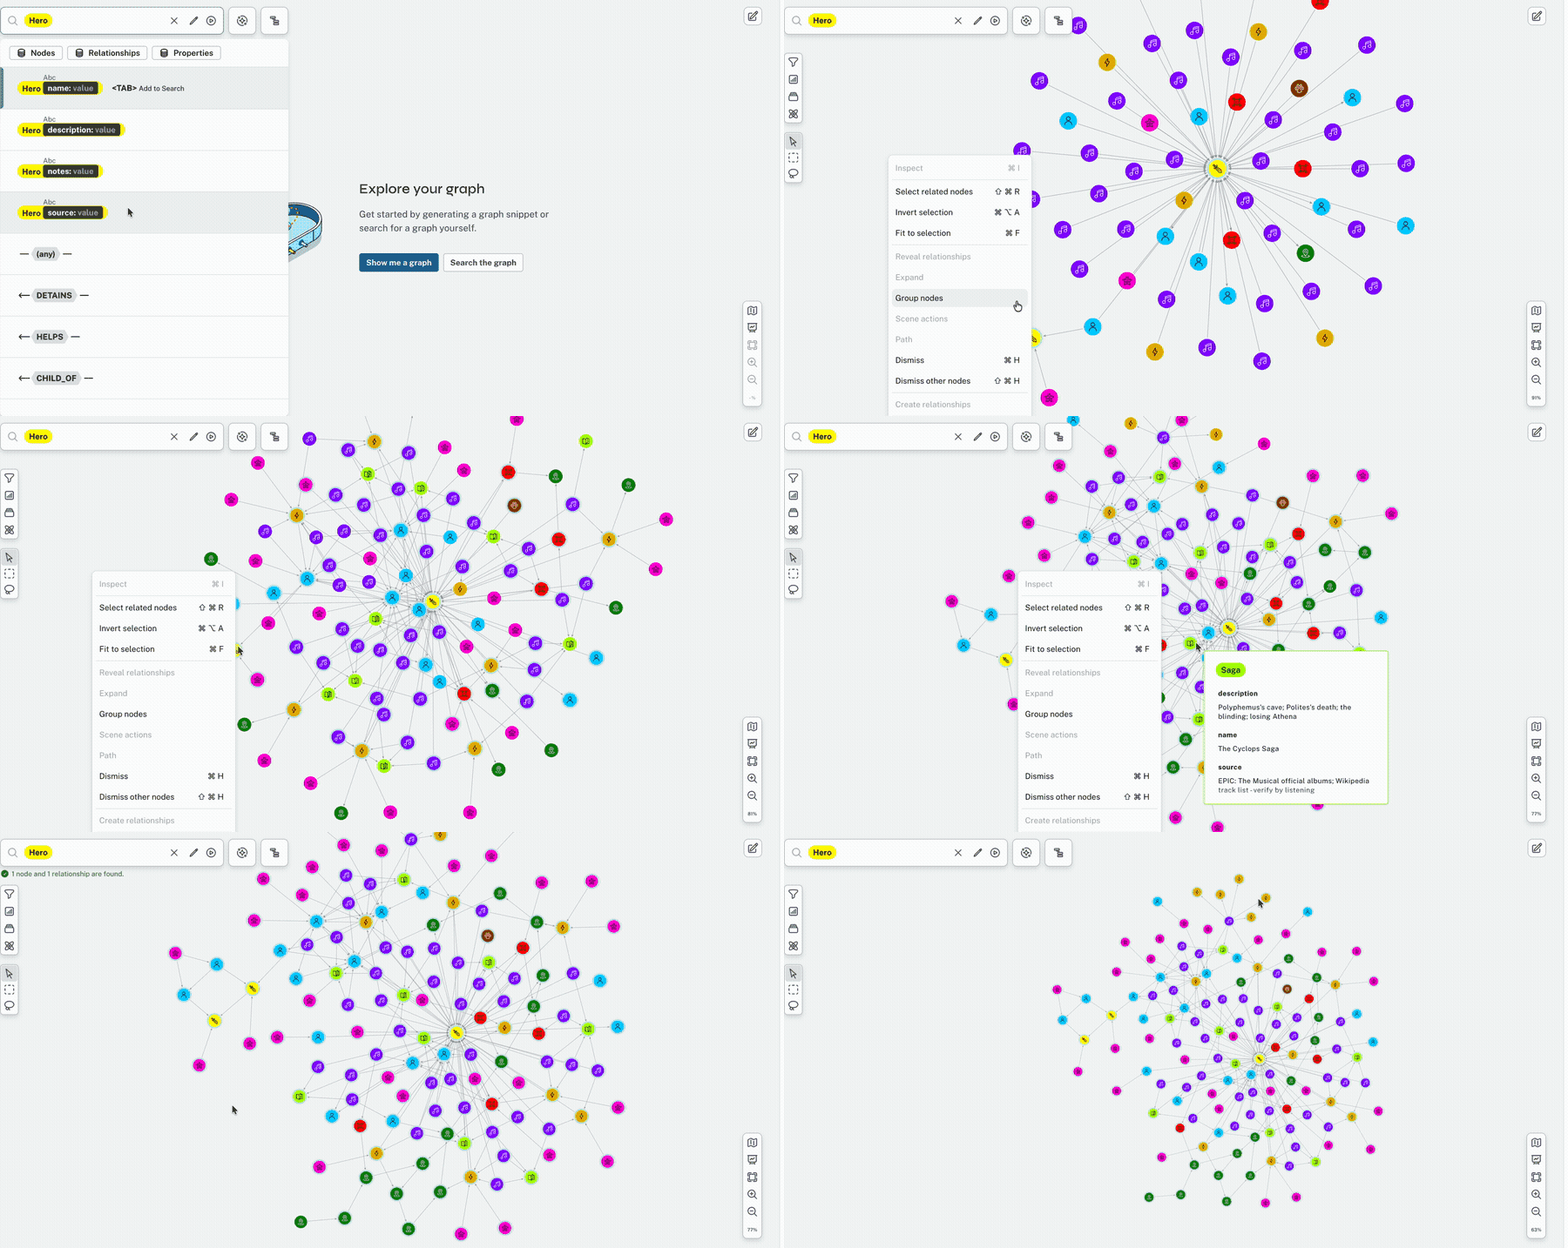
Seeking a more intuitive medium for relational data, Ojogbede imported the CSVs into a graph database utilizing Neo4j Aura’s free tier and its built-in visualization tool, Bloom. Using simple Cypher queries, the data was parsed into a visual canvas. Wave by wave, the 130 nodes bloomed outward, transforming lines of text into a brilliant, color-coded constellation representing gods, monsters, musical tracks, characters, and actors.
Yet, as she stepped back to admire the visualization, an anomaly immediately caught her eye. Floating entirely apart from the main narrative cluster, separated by a vast expanse of empty canvas, was a distinct island of data points.

This isolated cluster contained Agamemnon, Menelaus, Helen of Troy, Clytemnestra, and their corresponding actors. While these nodes were properly connected to one another through familial and occupational relationships (such as MARRIED_TO or PLAYS), not a single arrow bridged this group to Odysseus’s core plotline. The Trojan War subnarrative had been completely severed from the rest of the dataset.
Phase 3: The Ten-Second Remediation
Recognizing the structural gap, Ojogbede consulted the source material. In Book 4 of The Odyssey, Odysseus’s son, Telemachus, travels to Sparta to visit Menelaus in search of news regarding his missing father.
Resolving the structural isolation required merely three lines of Cypher code to establish the missing connection:

MATCH (t:Character name: "Telemachus")
MATCH (m:Character name: "Menelaus")
MERGE (t)-[:VISITS]->(m)
Upon executing this query, the isolated island of data instantly snapped into place, bridging the Trojan War plotline with the broader narrative canvas. Weeks of traditional table-reading had failed to expose the omission, whereas a force-directed graph layout laid it bare in a single glance.
Supporting Data: Comparative Analysis of Data Structures
To understand why traditional spreadsheets concealed an error that graph databases instantly illuminated, data architects must examine the fundamental mechanics of how different data structures store information.
| Feature / Capability | Relational Tables (CSVs / Spreadsheets) | Graph Databases (Nodes & Edges) |
|---|---|---|
| Primary Storage Unit | Rows and columns (attributes of an entity). | Nodes (entities) and edges (directed relationships). |
| Handling of Relationships | Implicitly indicated via matching foreign keys or shared values. | Explicitly stored as first-class objects (arrows with specific types). |
| Error Detection Strengths | Counting anomalies, duplicate entries, empty cells, and incorrect date formats. | Identifying missing connections, orphaned clusters, structural isolation, and circular logic. |
| Visual Feedback Mechanism | Discrepancies appear as mismatched numbers or blank table cells. | Discrepancies appear as spatial distance, isolated nodes, or severed network branches. |
| Ideal Use Cases | Financial ledgers, inventories, tabular logs, and categorical data counting. | Social networks, fraud detection, supply chain tracking, and narrative mapping. |
As Ojogbede’s analysis proves, tables are fundamentally optimized for values, whereas graphs are optimized for connections. If an error resides within a data point (e.g., a misspelled name or an incorrect numerical total), a table will catch it through sorting and filtering. However, if an error resides in the absence of a connection—a structural omission where a relationship ought to exist—a table provides no visual cue, because empty space in a spreadsheet looks identical to valid non-relation.

Official Responses and Educational Implications
The broader academic and developer communities have embraced Ojogbede’s project not merely as a creative novelty, but as a valuable pedagogical tool for data science education.
Published originally as an interactive tutorial via Neo4j’s GraphAcademy, the project provides open-access resources for students and professionals eager to learn graph database modeling. The complete dataset, data models, import scripts, and visualization instructions have been made publicly available on GitHub and the Neo4j GraphAcademy repository.
Educational experts note that introducing complex technical concepts through familiar cultural touchstones—such as ancient mythology and modern viral media—drastically lowers the barrier to entry for aspiring data analysts. By reframing a database query as an exploration of literary relationships, learners grasp advanced concepts like Cypher syntax, force-directed algorithms, and network topology organically.

Implications: Beyond Myth to Real-World Applications
While mapping The Odyssey serves as an engaging intellectual exercise, the underlying principles carry profound implications for enterprise data management, cybersecurity, and institutional analytics. Invisible structural errors are not unique to mythological databases; they routinely plague mission-critical data systems across global industries:
- Corporate Governance and Organizational Structures: Enterprise human resource systems frequently maintain organizational charts in relational formats. Structural gaps—such as entire departmental teams operating without a designated reporting manager—often go unnoticed in tabular directories, leading to operational blind spots that graph-based org charts would immediately isolate.
- Cybersecurity and Fraud Detection: Modern financial crimes rely on obfuscation. Fraudsters frequently create networks of seemingly unrelated bank accounts, corporate entities, and shell companies. While each individual account entry appears legitimate in a tabular audit, mapping transactions and shared identifiers as a graph reveals hidden criminal rings—exposing the classic "Agamemnon island" of illicit financial networks.
- Information Architecture and Web Development: Large-scale enterprise websites and documentation repositories often struggle with "orphan pages"—content nodes that exist within a database but possess no inbound hyperlinks from the site architecture. While content management systems list individual articles cleanly, visual graph mapping instantly reveals disconnected content islands that degrade user experience and search engine optimization.
Conclusion: The Graph as the Finding
Kemi Elizabeth Ojogbede’s journey from a fan-driven internet argument to a structural data revelation underscores a vital truth for modern data scientists: the medium of analysis dictates the nature of discovery.
When data is fundamentally about relationships, forcing it into rigid rows and columns risks blinding the analyst to structural absences. By embracing graph-based visualization, analysts allow spatial algorithms to perform preliminary audits automatically—clustering what belongs together, exiling what is orphaned, and drawing the human eye directly to the empty spaces where connections should be.

As professionals across industries continue to manage increasingly complex webs of interconnected information, Ojogbede’s project offers a timeless reminder: sometimes, to truly understand your data, you must stop reading the rows and start looking at the space between them.
 Azzam Bilal Chamdy
 Asep Darmawan
 Suro Senen
