In an era defined by information overload and skepticism toward digital media, brands face a relentless challenge: cutting through the noise. With global studies showing that up to 79% of adults believe social media makes people increasingly susceptible to misinformation, building genuine consumer trust has never been more difficult—or more essential.
Enter data storytelling. By combining rigorous facts, compelling narratives, and accessible visualizations, modern marketers are transforming dry spreadsheets into magnetic content that earns high engagement, builds lasting authority, and drives real-world business results.
Main Facts: What is Data Storytelling and Why Does It Matter?
Data storytelling is the practice of using quantitative information—facts, statistics, and metrics—to build a persuasive narrative that audiences can easily understand and act upon. Rather than letting numbers sit in isolation, data storytelling bridges the gap between logic and emotion.
As Leeann Froese, Digital Marketing Manager at Town Hall Brands, points out: "Using data to tell stories from a brand’s point of view can be very effective, as it bridges that place between logic and emotion and lets a brand connect with a reader on a deeper level."
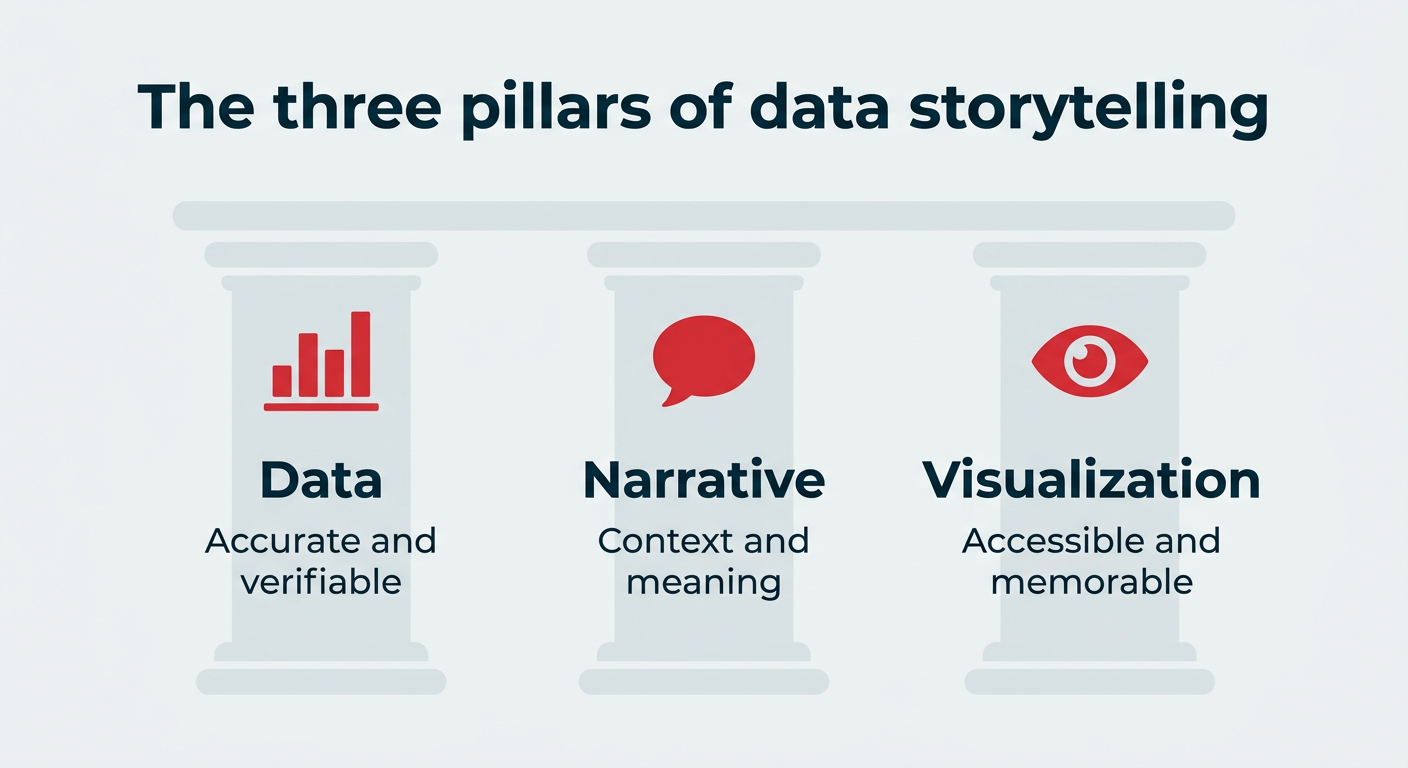
Every effective data story rests upon three core pillars:
Data: The foundational bedrock of accurate, relevant, and verifiable information.
Narrative: The contextual framing that gives the numbers meaning, stakes, and a clear takeaway.
Visualization: The graphical formatting that allows the human brain to process the information rapidly in a fast-paced social media feed.
When executed properly, data storytelling provides a layer of factual proof that elevates a brand above the superficial fray of standard social media noise. This proof builds authority at scale, transforming abstract figures into relatable, emotionally resonant stories.
Chronology & Frameworks: The Evolution of the 5 C’s
While the concept of data-driven marketing has evolved alongside digital analytics platforms, the underlying architecture of human storytelling remains rooted in classical dramatic structures. To turn a raw statistic into a compelling social post, marketers rely on the 5 C’s framework: Context, Characters, Conflict, Climax, and Closure.
Context: Establishing the setting, timing, and why the trend or business problem matters right now.
Characters: Identifying who the story is about—whether that is your customers, community, internal team, or a specific audience segment.
Conflict: Highlighting the tension, gap, risk, or missed opportunity that the data reveals.
Climax: Delivering the headline statistic or insight that reframes the issue.
Closure: Providing a clear, actionable resolution or call to action tied directly to the data.
When applied chronologically to content creation, this narrative arc prevents a social media post from devolving into a boring list of figures, giving the audience a clear beginning, middle, and reason to care.
Supporting Data & Real-World Examples
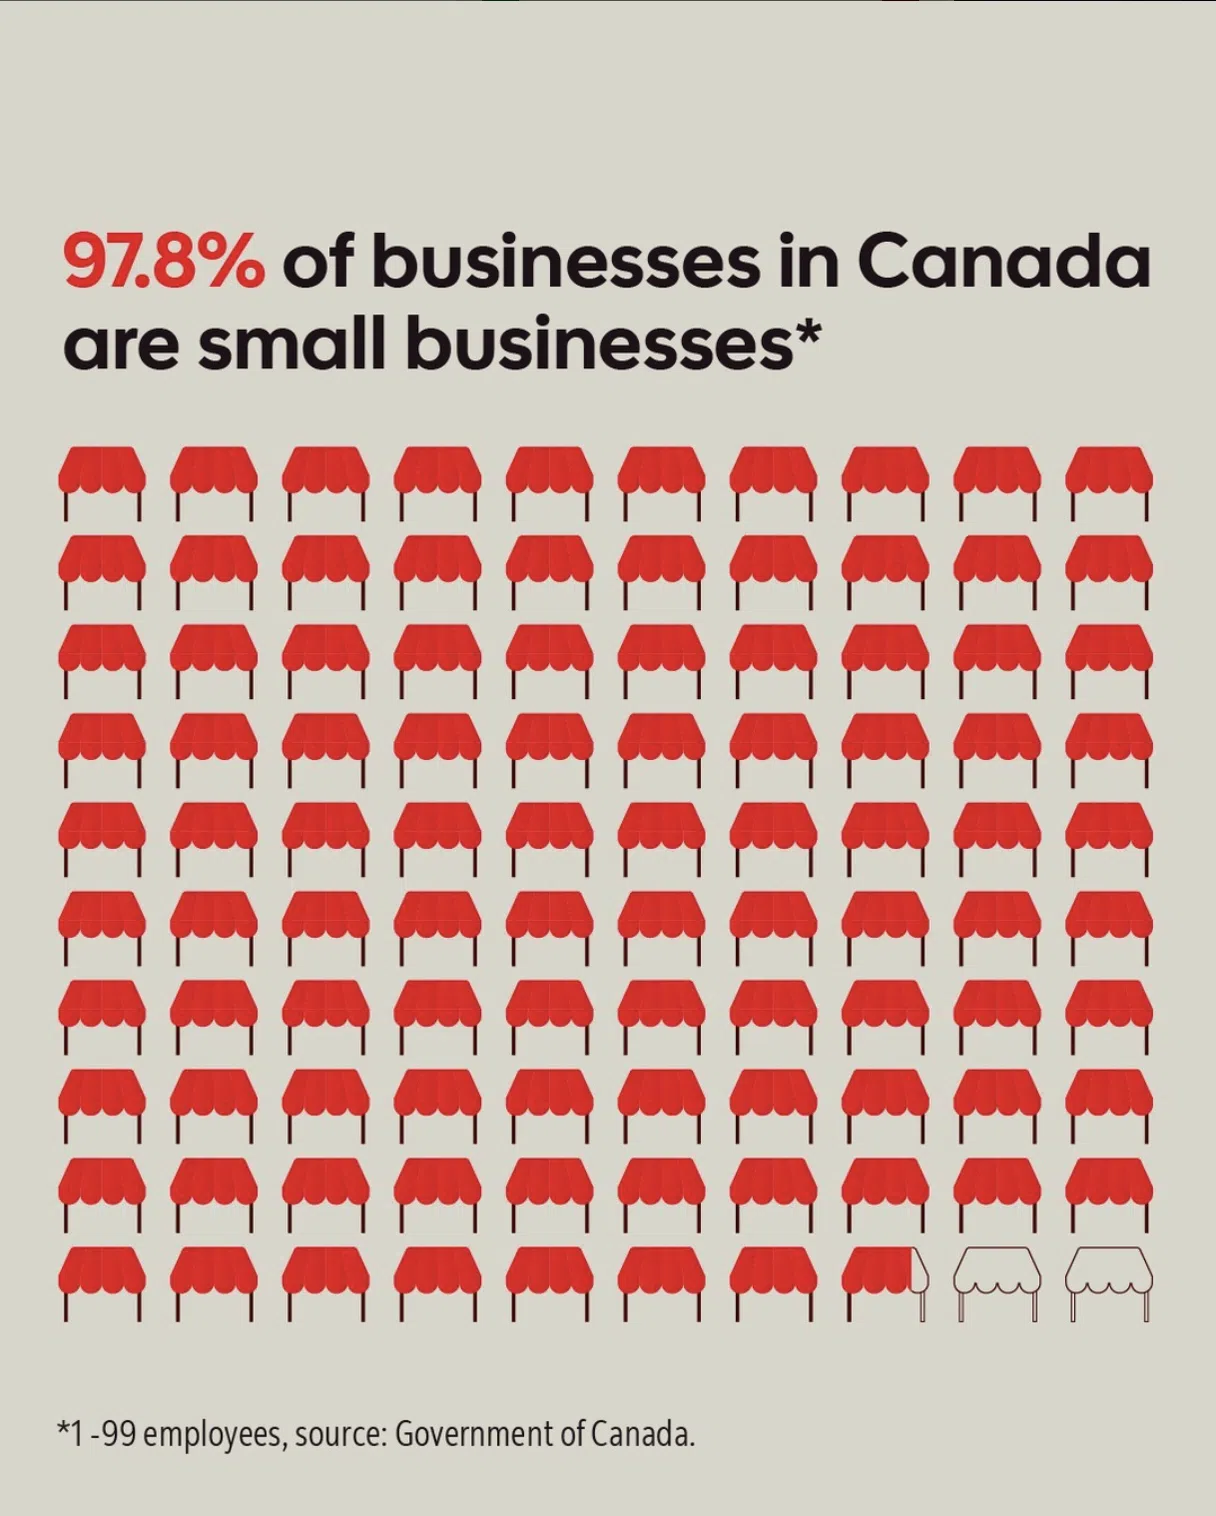
The power of data storytelling is best understood through brands that have successfully translated metrics into viral movements and deep emotional connections.
1. Dove’s "Hard Knocks" Campaign
Personal care brand Dove famously utilized data to spark social change. Their "Hard Knocks" campaign began with lighthearted clips of young girls playing sports, only to deliver a jarring reality check at the video’s conclusion: 45% of girls quit sports by age 14 due to body confidence issues. By anchoring the data at the end of an emotionally engaging narrative, the brand drove massive engagement and directed viewers to a clear call-to-action website.
2. Farmers Pick’s Zucchini TikTok
On platforms like TikTok, where the first few seconds dictate whether a user scrolls away, data makes for an exceptional hook. Australian produce company Farmers Pick kicked off a viral video with a stark statistic: "1,500 kgs of zucchinis rejected by supermarkets because they don’t meet ridiculous beauty standards." Pairing this data with visual shock value generated over 12,000 comments, proving how quantitative insights can effectively drive awareness around food waste.
3. Pinterest Predicts
Pinterest utilizes its massive library of search data to curate future trends. By highlighting growing search terms like "discard recipes" and "scrap quilt patterns," Pinterest tells a cohesive narrative about sustainability and resourcefulness, turning raw analytics into actionable inspiration for its users.
Official Responses and Expert Insights
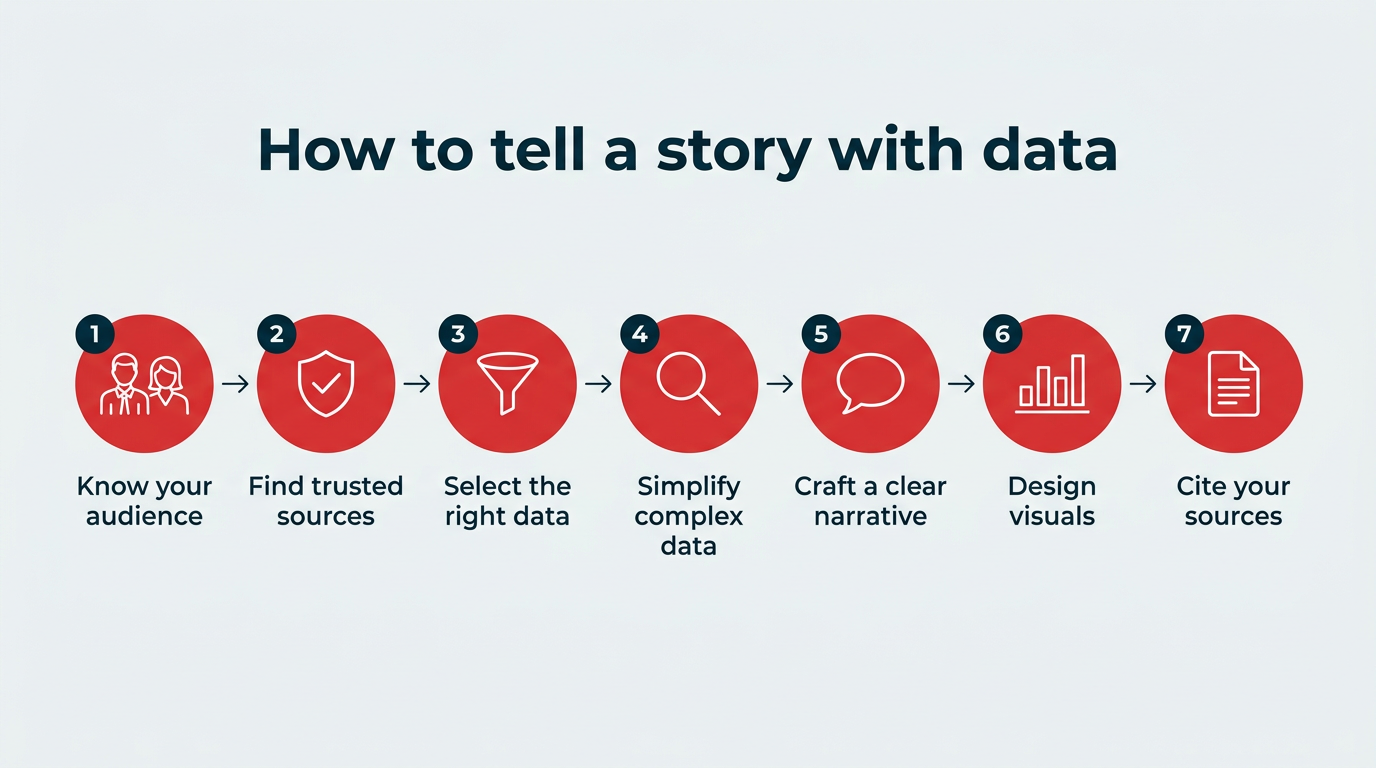
Industry professionals emphasize that data integrity is non-negotiable. In an online ecosystem flooded with unverified claims, brands must exercise strict ethical standards regarding where they source their numbers.
"Presenting verified, peer-reviewed data or trusted sources can further enhance credibility, reassuring audiences that a brand is trustworthy and responsible," says Leeann Froese. "Transparency fosters stronger relationships, demonstrating that a brand is not just selling but also sharing meaningful insights."
Experts strongly advise against manufacturing statistics or bending numbers to fit a predetermined marketing narrative. If a marketer cannot comfortably name a trusted, third-party source or back up their internal sales metrics, the data does not belong in the public sphere. Transparency acts as a vital shield against public relations disasters and deepens consumer trust.
Implications for Social Media Marketers
For digital marketers navigating declining organic engagement rates—such as median Instagram brand engagement hovering around 9.7%—data storytelling offers distinct strategic advantages:
Enhanced Brand Authority: Offering concrete proof sets a brand apart from competitors relying solely on subjective claims.
Simplified Complexity: Translating large, abstract numbers into relatable analogies (e.g., “This year’s production could fill 10,000 glasses!”) makes complex ideas approachable for audiences seeking quick entertainment.
Clearer Reporting Signals: Data-led content produces distinct performance metrics, making it significantly easier to demonstrate return on investment (ROI) and explain to executive leadership why a specific campaign resonated.
Common Pitfalls to Avoid
To maximize the impact of data-driven campaigns, marketers must actively avoid these common mistakes:
Overwhelming the Audience: Crowding a single graphic with too many numbers or complex charts.
Using Unverified Sources: Relying on unvetted social media posts rather than professional, credible data repositories.
Forgetting the Call to Action: Presenting a fascinating statistic without telling the audience what to do next.
Ignoring Platform Context: Using the wrong visualization format—such as posting a dense spreadsheet graphic on TikTok instead of a dynamic carousel on LinkedIn or Instagram.
Conclusion
Data is far more than just a collection of cold, hard numbers; it is a unique opportunity to connect, inspire, and differentiate a brand in an overcrowded digital market. By mastering the three pillars of data storytelling, adhering strictly to the 5 C’s framework, and maintaining uncompromising transparency with trusted sources, social media marketers can turn abstract analytics into compelling stories that earn trust, drive shares, and inspire meaningful action.

 By Basiran






 Neng Nana
 Ammar Sabilarrohman
 Jia Lissa
