
 By Pevita Pearce
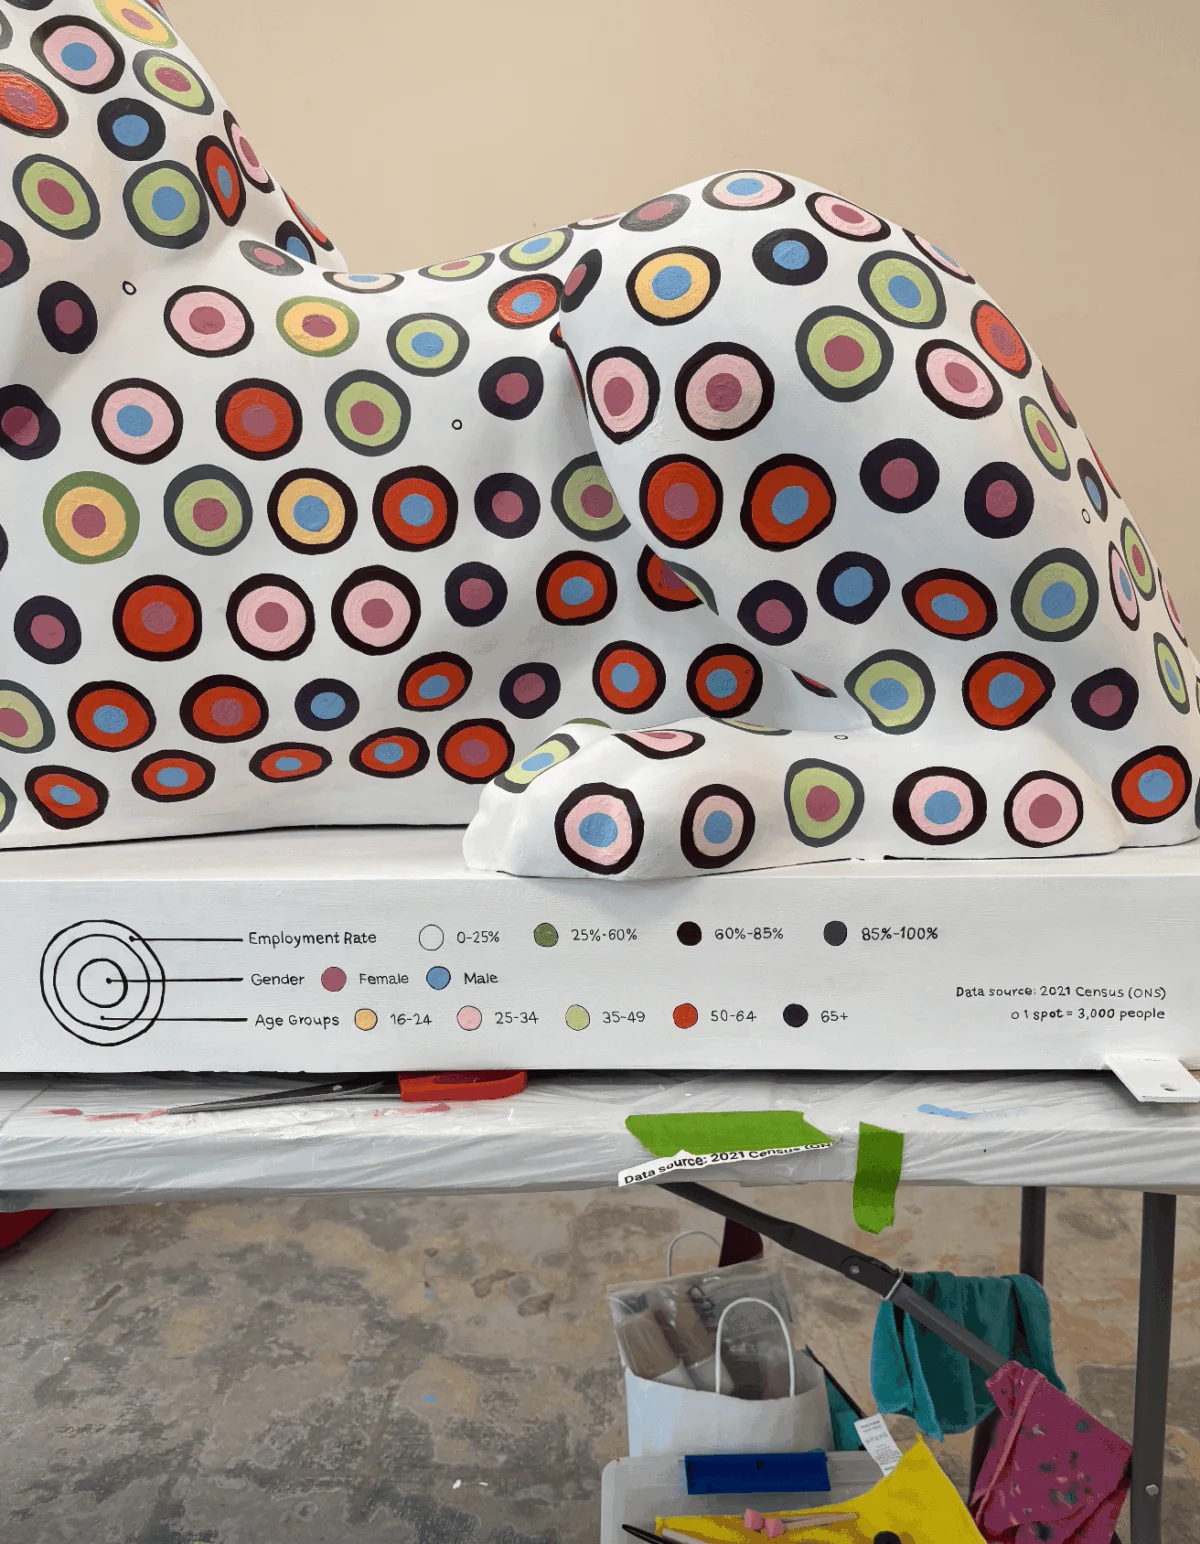
PORTSMOUTH, UK — When digital designer and researcher Or Misgav mindlessly scrolled through social media one evening, an advertisement for the “Pride of Portsmouth” art trail interrupted her feed. In an instant, her perspective shifted from passive consumer to data architect. Could a towering, three-dimensional fiberglass canvas serve as a medium for data advocacy? More importantly, could it become a visual love letter to her home city?
Launched on July 13, 2026, as a cornerstone of the historic Portsmouth 100 celebrations, the Pride of Portsmouth trail is far more than a standard public art exhibition. It is a sprawling, city-wide manifestation of local identity, creativity, and communal pride. Across the historic naval city, 45 life-sized lion sculptures stand as guardians of its heritage. Each lion is a bespoke creation, designed by a carefully shortlisted artist selected in tandem with corporate sponsors to ensure a diverse, vibrant collection that mirrors Portsmouth’s multifaceted population.
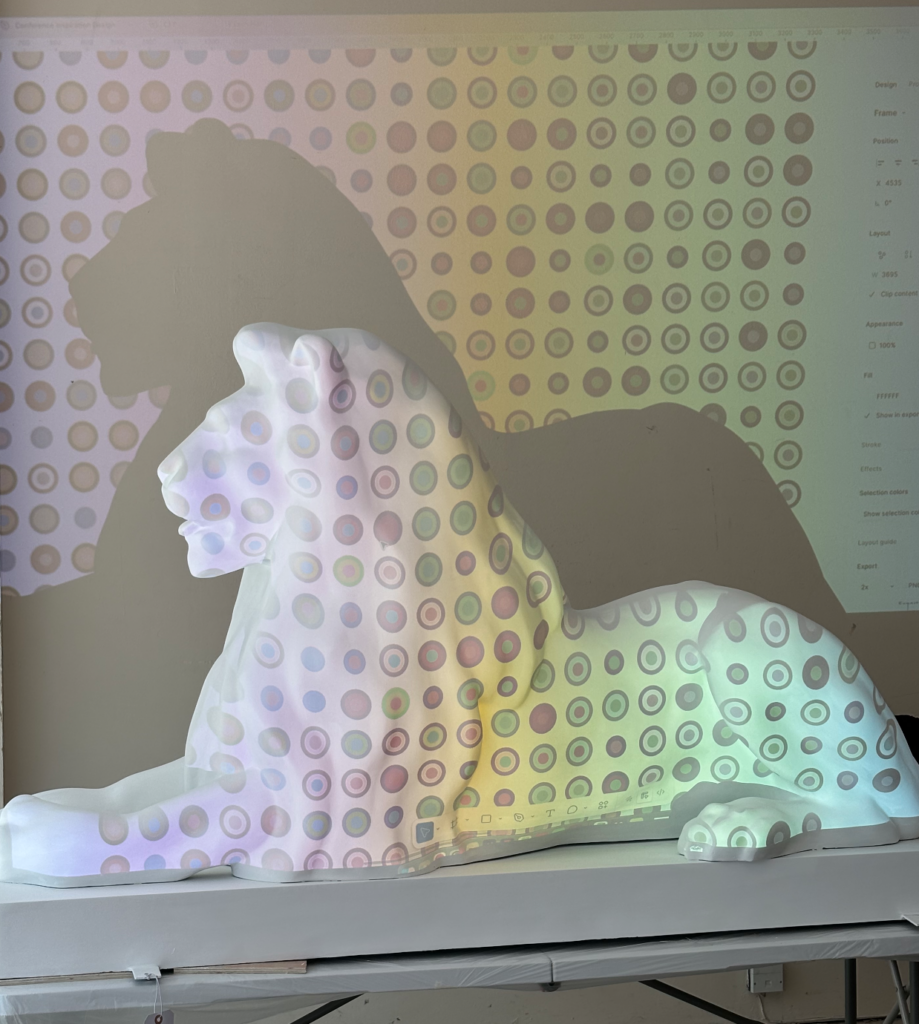
Measuring roughly 100 centimeters in height, 175 centimeters in length, and 60 centimeters in width, each fiberglass lion presented a daunting physical landscape. For Misgav, it marked the largest, most unorthodox canvas she had ever tackled—a massive leap away from the sterile, pixel-perfect confines of digital design software and straight into the unpredictable realm of public sculpture.
Sourcing the Soul of a City: Translating ONS Datasets into Art
Every compelling narrative begins with raw numbers. To construct a data visualization of this magnitude, Misgav needed an unyielding foundation. Spending countless hours navigating the expansive data vaults of the Office for National Statistics (ONS), she zeroed in on the 2021 Census—the most recent complete snapshot of the nation.

However, the wealth of information presented an immediate paralysis of choice. How does an artist choose between competing metrics on ethnicity, family structures, religious affiliations, public health, and employment rates?
Rather than reducing Portsmouth to a single, one-dimensional statistic, Misgav opted for a complex, dual-narrative approach. She mapped two distinct datasets onto opposite sides of the lion’s anatomy:

- The Left Flank: Cross-referenced metrics detailing general health status, religious affiliations, and age demographics.
- The Right Flank: Visualized employment rates broken down meticulously by age and gender.
The data yielded fascinating local insights. Misgav noted an encouragingly high employment rate across the local populace. Meanwhile, the census data revealed a striking cultural layout regarding faith: the vast majority of Portsmouth residents reported no religious affiliation, followed by Christianity as the largest professed faith, and Islam rounding out the top tier. Other spiritual categories fell beneath her standardized factor threshold, combining into fewer than 15 spots total.
The narrative took a deeply integrated turn when project sponsor Lakeside North Harbour stepped in. Seeking to visually anchor their patronage to the sculpture, they requested the inclusion of their primary corporate brand color. Misgav orchestrated a poetic synthesis: she designated the sponsor’s signature hue to embody “Good Health Status.” It was a fitting tribute to the census data showing that the vast majority of Portsmouth citizens enjoy robust health.

From Digital Perfection to Physical Chaos: The Chronology of Creation
Translating a digital grid into a physical masterpiece is rarely a linear journey. For Misgav, the process was a grueling test of adaptability, patience, and physical endurance that spanned four intense weeks.
Phase One: The Digital Blueprint and Color Theory
Before a single drop of paint touched fiberglass, Misgav spent over four hours iterating the color palette and stacked data layers. She meticulously balanced the visual weight of each attribute—determining what belonged on the outer perimeter versus the inner core, and how the data split across circles and halves. Fascinated by the capacity of circles to hold overlapping narratives without relying on raw numbers, she established a visual language where geometry superseded digits.

Phase Two: The Projection Pitfall
On the eve of painting, anxiety kept Misgav awake, contemplating potential points of failure. Accustomed to the safety net of digital design tools—where holding the SHIFT key snaps elements to a flawless grid and a single click alters global color palettes—she initially attempted to use a digital projector to cast her Figma grid directly onto the sculpture.
The method failed miserably. The projector’s vertical angle distorted the margins, throwing row spacing entirely out of alignment. Worse still, the projection appeared flat, completely ignoring the lion’s natural anatomical curves. Repeated attempts using washable markers left the sculpture covered in a chaotic sea of dots. The pristine digital grid had collided with physical reality, and the digital perfection had collapsed.

Phase Three: The Breakthrough and Manual Plotting
A moment of clarity struck during a rush-hour commute on a Portsmouth double-decker bus. Observing the staggered arrangement of traffic ahead, Misgav realized the cars formed a natural "brick-wall pattern."
Arriving at her studio, she re-engineered her auto-layout grid into a honeycomb structure, spacing the circles slightly farther apart to allow the design to breathe along the lion’s contours. Aided by her husband, they utilized flexible paper templates and rulers—materials that naturally hugged the sculpture’s curves—to manually plot the center points of all 1,500 individual circles.

Phase Four: The Marathon of Execution
Grounded in data visualization pioneer Alberto Cairo’s foundational pillar that a visualization must remain truthful to the data, Misgav faced an arduous painting process. To avoid miscounting data points, she constantly cross-referenced her tables, vocalizing every single spot out loud as she painted it—a formidable challenge within a communal studio buzzing with chatty artists.
Realizing the staggering amount of groundwork required, she drafted a midnight Gantt chart to optimize her schedule, ruthlessly sacrificing weekends, running routines, and social engagements to balance her PhD workload, family commitments, and the looming project deadline.

Collaborative Triumph and Stakeholder Perspectives
Despite the physical toll—characterized by permanently paint-stained fingers and recurrent dreams of geometric spots—the project evolved into a deeply collaborative triumph. Assistance from friends, round-the-clock support from her husband and children, and steady guidance from the Pride of Portsmouth project manager provided the morale boost needed to cross the finish line.
Official stakeholders lauded the cross-sector collaboration. Representatives from Lakeside North Harbour noted that integrating corporate branding with public census data elevated community engagement, transforming a corporate sponsorship into an interactive public asset. Organizers of the Portsmouth 100 celebrations highlighted Misgav’s lion as a prime example of how modern data art can merge seamlessly with civic heritage.

Implications: Rethinking Data Art for the Public Sphere
The completion of the lion sculpture forced Misgav to fundamentally re-evaluate her philosophy on data presentation. She concluded that the true value of data art does not lie in the sterile perfection of a digital grid, but rather in the intentional, human messiness of its physical execution.
By stripping away axis labels and raw numbers, the installation functions as an open invitation for the public to act as data detectives. While the cognitive load of decoding the honeycomb patterns is undeniably high, it rewards the viewer with a layered, intimate portrait of Portsmouth’s demographic landscape.

Reflecting on the grueling four-week endeavor, Misgav remains resolute. When asked if she would approach the project differently or sign up again given the chance, her response is unequivocal: "No doubt I would do it again. Where do I sign up?"
 Azzam Bilal Chamdy
 Asep Darmawan
 Suro Senen
