
 By Lina Hope
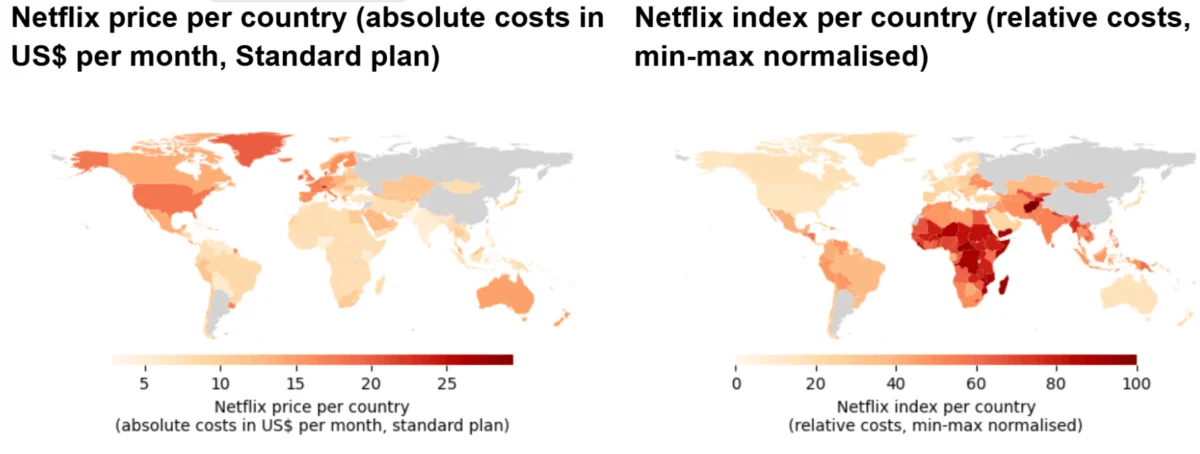
At first glance, Netflix’s global pricing structure appears to be a textbook example of corporate social responsibility. A standard subscription that costs a hefty $29 a month in Switzerland drops to roughly $7 in India, and plummets to a mere $2.84 in Pakistan. To the casual observer, this seems fundamentally equitable: wealthier nations shoulder a larger financial burden, while developing economies receive a proportional discount.
However, a new data-driven project by quantitative economist and postdoctoral researcher Colin von Negenborn suggests that this benevolent picture is largely an illusion. By introducing a novel metric known as the "Netflix Index"—which weighs subscription costs directly against local Gross Domestic Product (GDP) per capita—the analysis turns traditional assumptions about global price discrimination on their head. Once local purchasing power is factored into the equation, the financial burden of streaming entertainment shifts dramatically, revealing that lower-income countries are paying vastly more relative to their economic reality than their wealthy counterparts.
Main Facts: Unmasking the Cost of Entertainment
To understand the core thesis of the Netflix Index, one must first look at the stark contrast between absolute and relative pricing models.
- The Absolute View: In nominal terms, Netflix’s Standard-plan pricing heavily penalizes the Global North. Switzerland and Liechtenstein top the charts at approximately $29.37 per month, followed by Denmark, Greenland, the Faroe Islands (all around $19.95), and the United States ($17.99). Conversely, the cheapest absolute prices are found in Pakistan ($2.84), Nigeria ($4.64), and Kenya ($5.40).
- The Relative View: When these dollar amounts are divided by local GDP per capita and scaled into a 0-to-100 index, the hierarchy inverts completely. Afghanistan claims the maximum index score of 100.0, indicating the highest relative cost burden. It is closely followed by the Central African Republic (95.5) and Malawi (95.3).
- The Other Extreme: On the opposite end of the relative spectrum, affluent micro-states and territories reap the benefits of high income combined with capped regional pricing. Monaco sits at an index of 0.0, followed by Bermuda (5.9) and Macao (8.9), where a standard monthly subscription amounts to little more than a statistical rounding error for the average citizen.
Ultimately, while Netflix does practice third-degree price discrimination—segmenting markets to charge lower absolute prices in poorer nations—the scale of these discounts is severely misaligned with actual living standards. Income levels in wealthy countries scale far faster than the minor price adjustments Netflix applies abroad, leaving subscribers in Sub-Saharan Africa and South Asia to sacrifice a significantly larger slice of their disposable income.
Chronology: Building the Netflix Index Pipeline
To arrive at these counterintuitive conclusions, von Negenborn constructed a comprehensive, fully reproducible data pipeline utilizing Python, combining four distinct information domains and executing the project across three rigorous analytical steps.
Step 1: Data Acquisition and Preparation
The project began by mapping out the global availability of Netflix. Out of 249 countries listed in the corporation’s database, Standard-plan prices were successfully extracted for 245 territories (China, North Korea, Russia, and Syria were excluded due to lack of service availability).
Because manual collection across hundreds of distinct localized web pages would be impossibly tedious, automated web-scraping scripts were deployed. These scripts scanned Netflix’s infrastructure to harvest local prices, which surfaced in a bewildering array of formats—from decimal-based Western currencies to complex local notations like 800 rupees or 231,000 Vietnamese dong.
Next, financial data was integrated to convert every national currency into US dollars. Daily exchange rates were pulled via automated APIs from the European Central Bank (ECB), supplemented by targeted web scraping on XE.com for smaller or more obscure currencies. An early hurdle emerged in Argentina, where chronic hyperinflation and severe exchange-rate instability produced an absurdly distorted conversion rate exceeding $250 per month; consequently, Argentina was dropped from the dataset to prevent analytical skewing.
To measure living standards, economic data was pulled directly from the World Bank via its official API, translating country codes into localized GDP per capita metrics. Finally, official United Nations geographical data was integrated using ISO country codes, turning raw rows of economic figures into spatial coordinates ready for map rendering.
Step 2: Data Analysis and Mathematical Transformation
With absolute prices and economic output unified in US dollars, relative costs were computed by dividing each country’s Netflix price ($p_i$) by its GDP per capita ($y_i$).
To make this dataset manageable and comparable, two major statistical adjustments were made:
- Removing Skewness: Burundi presented an extreme outlier due to its combination of the world’s lowest GDP per capita and a standard $7.99 subscription fee. After removing this anomaly, a logarithmic transformation (specifically, adding 1 before taking the log) was applied to compress the right tail of the distribution, creating a more symmetric dataset without altering country rankings.
- Min-Max Scaling: To convert these figures into an intuitive metric, a min-max scaler mapped the adjusted relative values onto a 0-to-100 scale. The lowest relative financial burden was assigned a 0, and the highest was set at 100.
Step 3: Visualizing the Findings
To communicate the findings effectively, the project utilized two primary visualization methods. First, static choropleth maps were generated using Python’s Matplotlib library, placing absolute-price world maps side-by-side with Netflix-index maps. The visual inversion was stark: the dark-red zones of high absolute cost in North America and Western Europe transformed into light tones, while the light-red zones of the Global South exploded into deep, ominous reds.

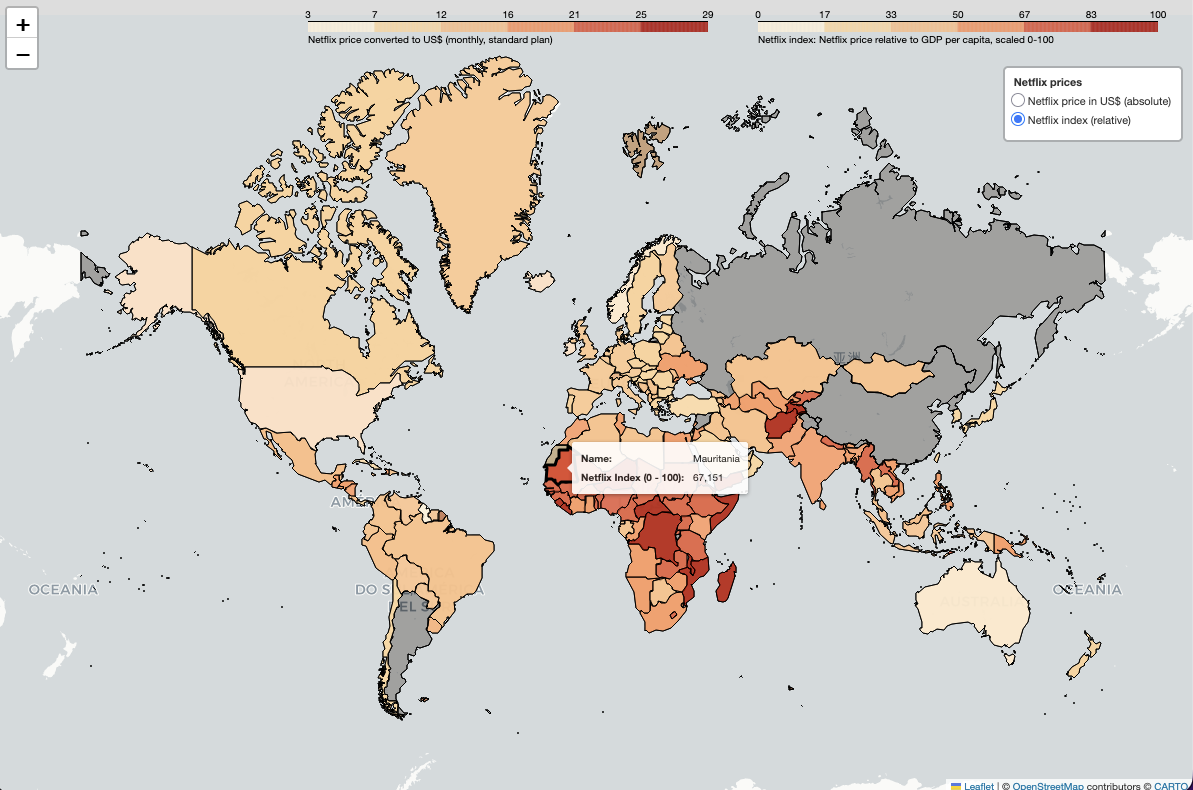
To allow for deeper exploration, an interactive map was built using the Python folium library. This allowed users to toggle seamlessly between absolute and relative views, hovering over individual countries to inspect exact index scores and pricing discrepancies.
Supporting Data: The Mechanics of Price Discrimination
Economically speaking, Netflix’s strategy falls under third-degree price discrimination, a practice where a monopolist segments a heterogeneous market into groups and charges each group a different price based on their willingness and ability to pay. In theory, this maximizes both corporate profits and total market welfare by capturing consumers in developing markets who would otherwise be priced out of the ecosystem.
However, the empirical scatter plots generated by this research reveal a critical flaw in Netflix’s execution: the regression line mapping subscription prices against GDP per capita has a remarkably shallow slope.
While prices do increase alongside national income, they do so at a fraction of the speed. When a Swiss citizen earning a high annual income pays $29, the transaction represents a negligible fraction of their purchasing power. Conversely, when a consumer in a low-income nation pays $5 or $7—often for a vastly restricted local content library—that expenditure competes directly with basic household necessities.

The data proves that current multinational pricing models fail the test of true proportionality. Rather than scaling equitably with local wealth, pricing tiers are conservative, leaving emerging markets subsidizing the perceived value proposition of mature Western markets.
Official Responses and Industry Context
As streaming platforms face market saturation in North America and Western Europe, their primary growth vectors lie squarely in the Global South—specifically across Latin America, Southeast Asia, and parts of Sub-Saharan Africa.
To date, major streaming conglomerates like Netflix, Disney+, and Amazon Prime Video have publicly defended their regional pricing strategies as proof of localization and market adaptation. Executives frequently point to the introduction of lower-cost, ad-supported tiers, mobile-only plans, and localized promotional pricing as evidence that they are lowering barriers to entry for developing economies.
Yet, industry analysts note that these corporations face a delicate balancing act. If they lower prices in developing nations to truly match local purchasing power parity (PPP), they risk triggering massive gray-market account sharing, cross-border arbitrage, and diminished perceived brand value. Furthermore, the rising cost of content production, international licensing agreements, and localized server infrastructure create a hard floor beneath which subscription prices cannot fall without compromising profit margins.

Netflix corporate representatives have not directly commented on the findings of the Netflix Index project. However, industry insiders suggest that streaming algorithms and regional pricing teams rely primarily on broad macroeconomic indicators—such as median national income, smartphone penetration rates, and local competitor pricing—rather than granular GDP-per-capita proportionality ratios.
Implications: The Future of Global Digital Economics
The implications of the Netflix Index extend far beyond a single streaming application. They highlight a broader structural flaw in how multinational digital service providers price intangible goods across unequal global economies.
1. The Digital Divide Deepens
As entertainment, education, and professional tools migrate entirely to subscription-based cloud models, the inability of developing economies to access fairly priced digital goods risks exacerbating global inequality. If digital services remain relatively more expensive in poor countries, access to modern culture and information becomes an increasingly exclusionary privilege.
2. Methodological Shifts for Digital Economists
Colin von Negenborn’s open-source pipeline—hosted entirely on GitHub for public verification—provides a blueprint for evaluating other multinational tech giants. Analysts can easily apply this methodology to Spotify, YouTube Premium, cloud storage providers, and software-as-a-service (SaaS) platforms to see if their global pricing models similarly penalize the Global South.

3. Areas for Future Research
While the Netflix Index provides a massive leap forward in transparency, the author notes several inherent limitations that future iterations must address. Notably, GDP per capita is merely a macro-level average that obscures deep internal income inequality within nations; a subscription that appears affordable on paper may still be completely out of reach for marginalized or rural populations. Additionally, fluctuating tax policies (such as VAT versus gross pricing) and vastly different regional content catalogues complicate direct apples-to-apples comparisons.
Conclusion
Ultimately, the Netflix Index shatters the comforting narrative that global tech companies are successfully balancing equity with profitability across borders. By laying bare the mathematics of modern price discrimination, this project forces consumers and economists alike to confront an uncomfortable truth: in the modern digital economy, the poor often pay the highest price.
 Azzam Bilal Chamdy
 Asep Darmawan
 Suro Senen
