
 By rifanmuazin
Main Facts: The Illusion of Precision in Modern Sports Broadcasting
During the qualifying session at the 2026 Hungarian Grand Prix, Lewis Hamilton crossed the finish line to secure a front-row grid position, missing out on pole by a razor-thin margin. On global television broadcasts, timing towers and screen graphics flashed a familiar, clinical shorthand: +0.012s.
For the average viewer, the number registers momentarily and vanishes. It is an abstract quantity—twelve thousandths of a second—rendered as digital text. It requires mental arithmetic, yet offers no visceral feedback. It does not evoke a sensation of speed, proximity, or tension.
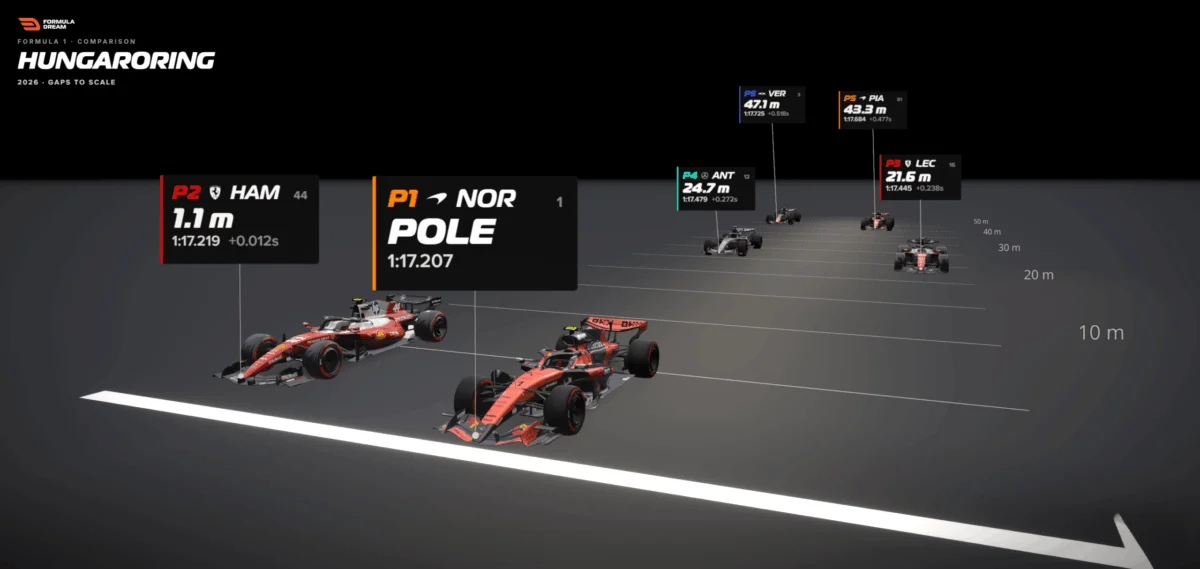
Yet, when that exact same time differential is converted into a physical distance, the nature of the data transforms entirely. At Formula 1 speeds of roughly 300 kilometers per hour, a car covers approximately 83 meters every single second. Multiplied out, 0.012 seconds translates to 1.1 meters of track—roughly the length of a single car’s nose cone.
Suddenly, the abstract becomes tangible. The television graphic shows a detached number, but the scale model reveals two multi-million-dollar racing machines nearly locked together, one driver’s front wing inches away from the gearbox of the other. Nothing about the underlying telemetry changed; only the unit of measurement did.
This perceptual gap exposes a fundamental challenge in modern data visualization: humans struggle innately with abstract quantities, but possess highly evolved, lifelong intuitions for physical space, size, and distance. When data fails to resonate, designers often commit the error of adding precision—more decimal places, finer granularities, or more complex charts—when the solution lies in spatial translation.
Chronology: From the Timing Screen to the Track Layout
The evolution of how motorsport data is consumed tells a story of increasing abstraction followed by a necessary return to physical context.
In the early decades of motorsport broadcasting, timing was communicated through crude manual lap-boards and basic sector stopwatches. Fans relied heavily on coarse metrics: who was ahead, who was pitting, and who was setting purple sectors.
As the sport modernized into a multi-billion-dollar global entertainment product fueled by real-time telemetry, data density exploded. The introduction of high-speed wireless sensors allowed broadcasters to beam micro-gaps down to the thousandth of a second directly into living rooms worldwide. Fans were given unprecedented mathematical accuracy, but at the cost of intuitive comprehension.
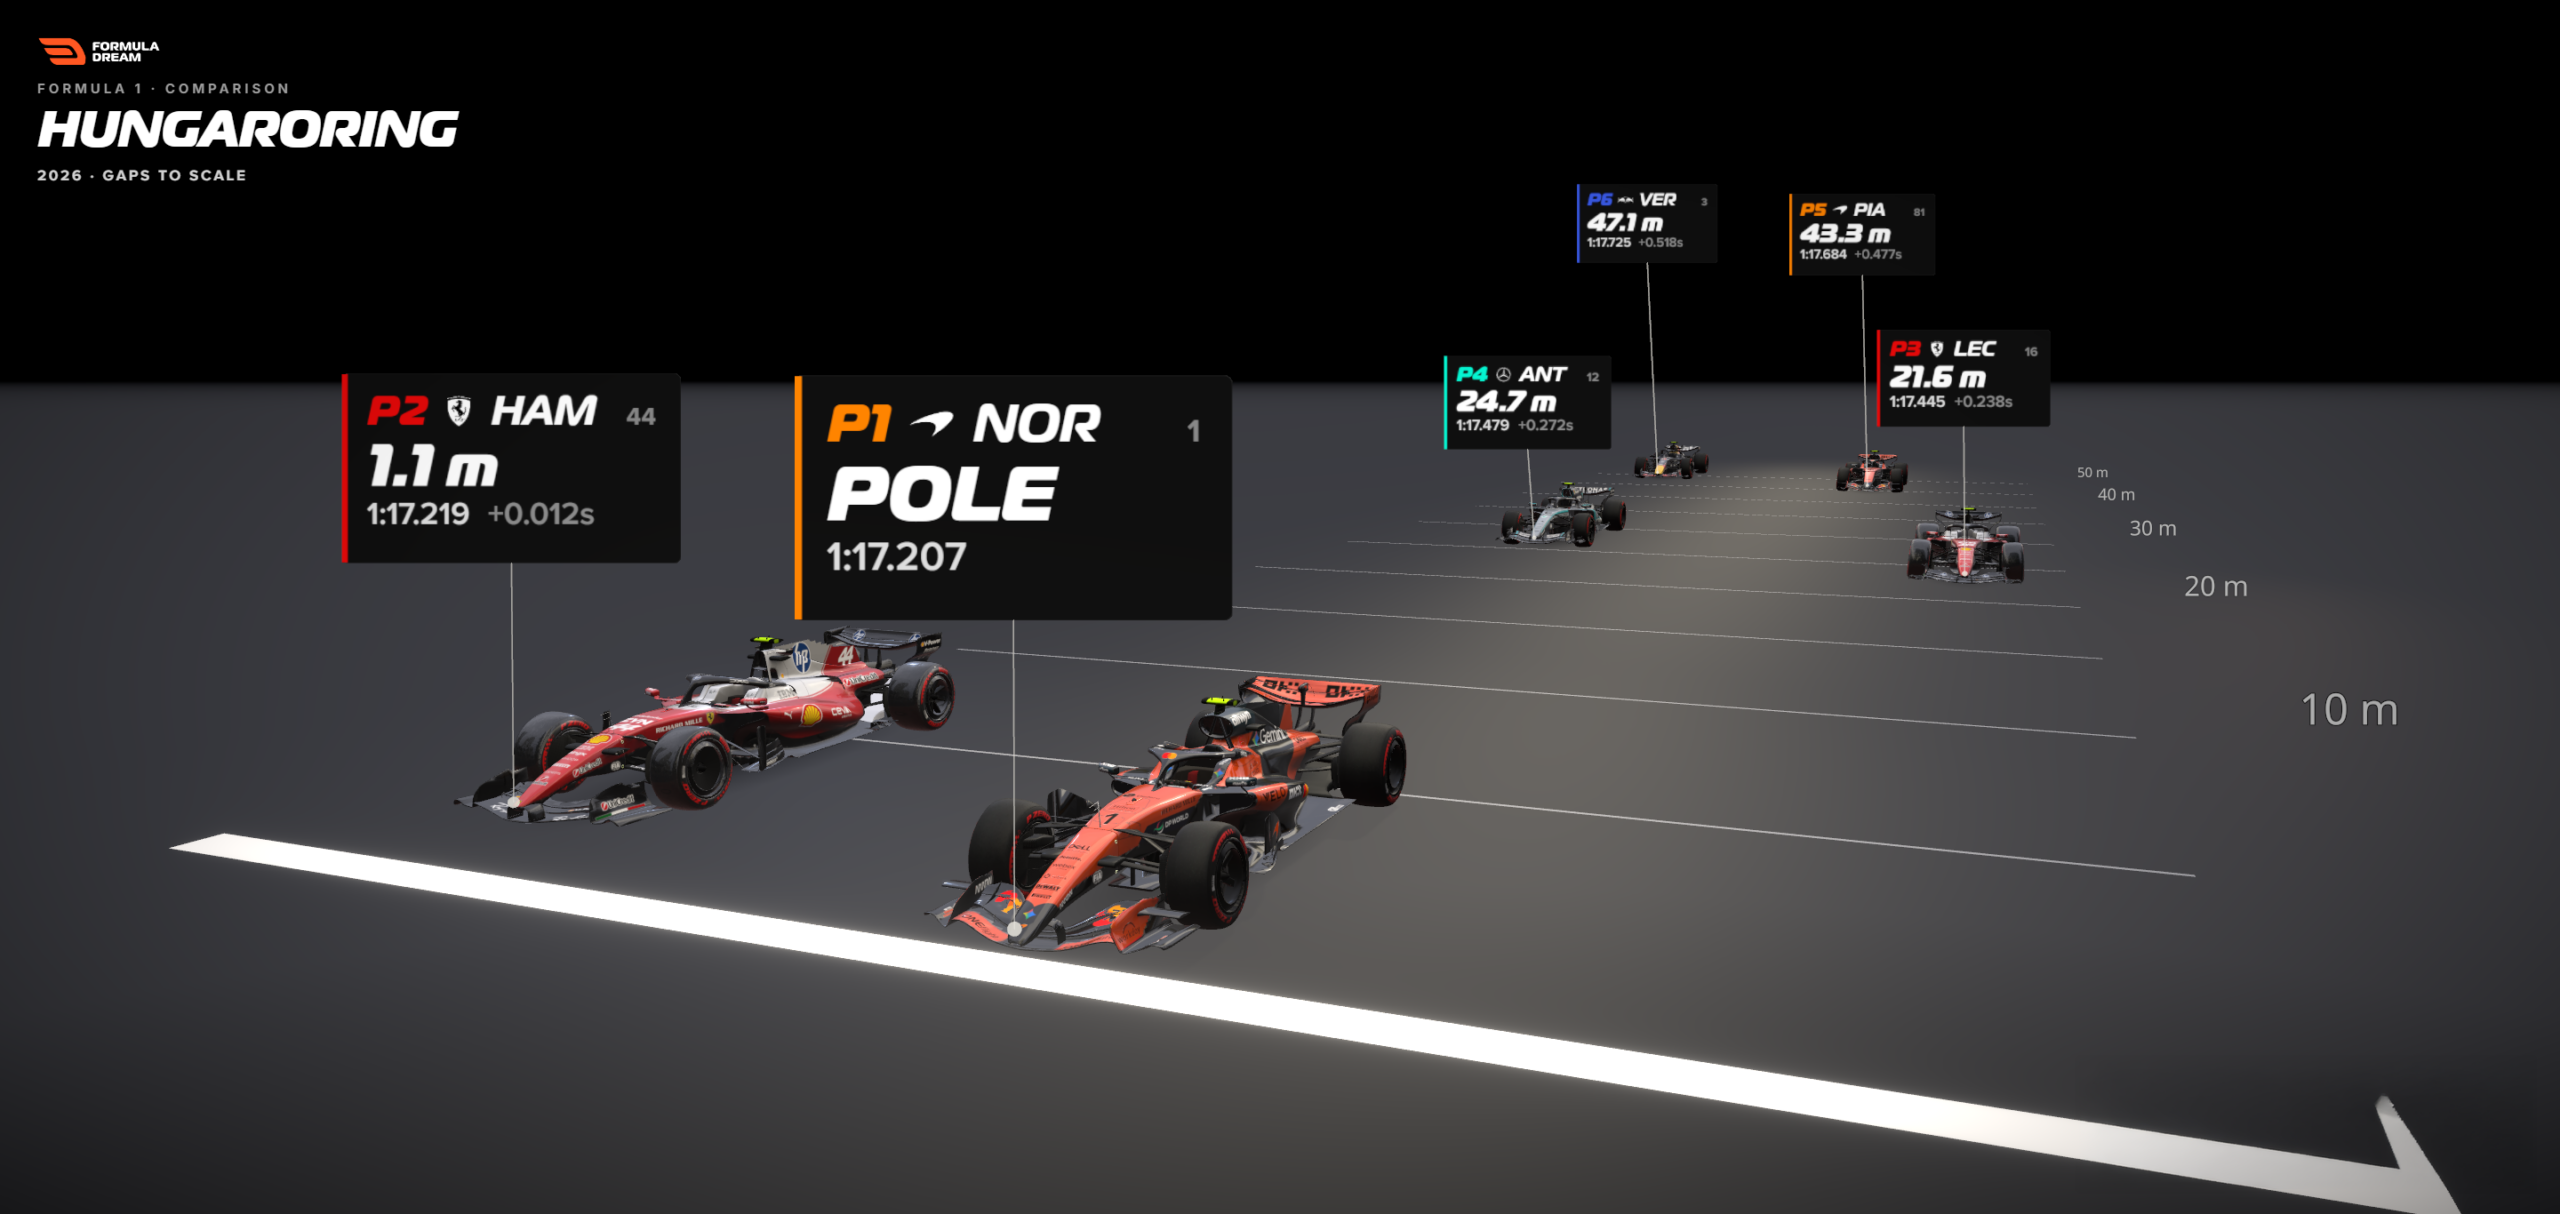
By the mid-2020s, interactive platforms like Formula Dream began developing advanced gap visualizers to bridge this cognitive divide. Instead of forcing viewers to mentally calculate what 0.518 seconds meant across a grid, developers mapped those timing deltas directly onto a to-scale representation of a Grand Prix start-finish straight.
This chronological shift—from raw analog timing to hyper-precise digital telemetry, and finally to spatial, human-centric data translation—marks a quiet revolution in sports analytics. It recognizes that while precision is essential for engineering teams on the pit wall, intuition is required for audiences in the stands and on the couch.

Supporting Data: Bar Charts vs. Spatial Scaled Visualizations
To understand why spatial translation works so effectively, one must examine how different visualization formats process identical datasets.
Consider the top six qualifiers from the 2026 Hungarian Grand Prix. The gaps to pole position span a seemingly narrow window on the timing screen:
- P2 (Lewis Hamilton): +0.012s
- P3: +0.238s
- P4: +0.312s
- P5: +0.450s
- P6 (Max Verstappen): +0.518s
The Conventional Bar Chart Approach
When mapped into a standard horizontal bar chart, these values rank the drivers accurately. The viewer can instantly determine that Verstappen was slower than Hamilton, and that the gap back to sixth place is significantly larger than the gap to second.
However, a bar chart suffers from a critical limitation: a bar is not a place.
- The viewer sees a short sliver for Hamilton and a longer bar for Verstappen.
- They understand that sixth place was further back, but they have no visceral sense of how far.
- The bar chart answers the analytical question "How much slower?" but remains entirely blind to the spatial question "Where were they on the track?"
The Spatial Track Layout Approach
When those exact same five timing gaps are converted into meters using the pole-sitter’s trap speed—calculating that 0.518 seconds balloons out to nearly 47 meters of tarmac—the psychological impact shifts instantly.

[POLE POSITION] -----------------------------------------------------> Finish Line
[P2: Hamilton]   (-1.1 meters / Car's nose behind)
[P3: Leclerc]    (-20+ meters back)
[P4 - P6]        (Stung out across nearly 50 meters of open track)
Laid out to scale on a straight with 5-meter interval markers, the visualization allows empty space to do the heavy lifting. The human brain immediately grasps that 47 meters is a massive gulf at racing speeds. The gap between two cars transforms from a cold mathematical inequality into a vivid physical narrative.
Official Responses and Methodological Transparency
A critical tenet of professional data journalism is absolute transparency regarding methodology and model limitations. When tools like the Formula Gap Visualizer translate temporal gaps into spatial meters, they rely on specific, replicable mathematical formulas:
$$textDistance in metres = textGap in seconds times left(fractextSpeed in km/h3.6right)$$
According to data architects and visualization designers like Bhavin Lathia, creator of Formula Dream, maintaining credibility requires acknowledging the inherent simplifications of the model.
- The Single-Speed Reference: The entire grid’s spatial positions are calculated using the reference pole-sitter’s measured speed through the speed trap near the start-finish line during their fastest lap. This ensures a uniform baseline.
- The Freeze-Frame Assumption: The model represents a static snapshot—hypothetically calculating where a trailing car would be at the precise millisecond the leader crosses the line if both traveled at the reference line speed. In reality, lap time deltas accumulate across complex low- and high-speed corners, not just straightaways.
- Visual Offsets: To ensure readability, cars plotted on the scale straight are nudged slightly sideways so they do not overlap. Designers explicitly state that this lateral offset carries zero data value; only the longitudinal distance along the track dictates the metric.
By proactively communicating these boundaries, data visualizers build trust. Readers accept a well-explained model with clear limitations far more readily than a "fake-precise" chart that pretends to capture complex dynamic realities without error.

Implications: The Broader Future of Human-Centric Data Design
The success of time-to-distance conversions in motorsport points toward a much broader design principle applicable across industries, from urban planning and economics to public health and environmental science.
1. Reclaiming Intuition in Complex Datasets
Whenever data deals with invisible or hyper-abstract units—whether it is gigabytes of data transfer, microscopic concentrations of pollutants, or planetary distances—the default industry response is to add precision. Yet, true comprehension often requires the opposite: finding a meaningful conversion rate that anchors the data into the human body’s built-in spatial and temporal intuitions.
- Urban Planning: Counting public transit stops often feels tedious and confusing. Replacing stop counts with estimated walking times provides an immediate spatial grip.
- Environmental Science: Quoting habitat destruction in square kilometers can feel sterile. Describing the loss as "an area the size of Wales" leverages known geographic mental models for immediate emotional resonance.
2. The Designer’s Core Mandate
The overarching lesson for data journalists and visualizers is clear: The data did not change; the container did.
When numbers fail to land with an audience, designers must stop searching for ways to make those numbers louder, sharper, or more detailed. Instead, they must ask: What physical, spatial, or experiential reality is this quantity equivalent to?
By transforming abstract temporal gaps into tangible physical distances, creators cross the chasm from cold calculation to genuine human understanding. A hundredth of a second is nothing; a car’s nose cone lunging forward on the asphalt is everything.
 Azzam Bilal Chamdy
 Asep Darmawan
 Suro Senen
