
 By Lina Hope
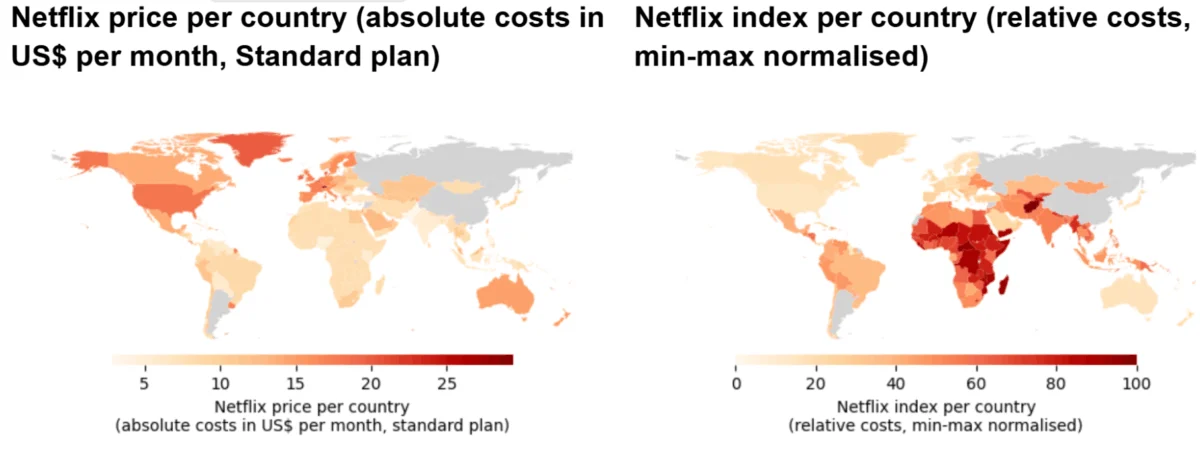
At first glance, Netflix’s global pricing strategy looks like a textbook example of corporate fairness. A standard monthly subscription costs roughly $29 in Switzerland, about $7 in India, and a meager $2.84 in Pakistan. Wealthier nations pay more; developing economies pay less. It is a seemingly equitable application of third-degree price discrimination—a common economic practice where firms segment markets to charge different prices based on localized willingness and ability to pay.
However, a newly developed quantitative measure called the Netflix Index suggests that this surface-level fairness is largely an illusion. Once analysts account for local purchasing power and Gross Domestic Product (GDP) per capita, the global pricing map flips entirely upside down. Far from receiving a discount, consumers in the Global South are shouldering a drastically higher relative financial burden for the exact same entertainment service than their counterparts in the affluent West.
All underlying code, scraping pipelines, and datasets for this project are publicly available on GitHub, offering a fully reproducible look into the economics of global streaming.
Main Facts: Absolute Wealth vs. Relative Pain
To understand the core paradox of international streaming costs, one must examine the chasm between absolute prices and relative economic impact.
- The Absolute Spectrum: In nominal US dollars, the highest monthly prices for a Netflix Standard plan are found in Switzerland and Liechtenstein ($29.37), followed by Denmark, Greenland, and the Faroe Islands (~$19.95), and the United States ($17.99). Conversely, the cheapest nominal rates are recorded in Pakistan ($2.84), Nigeria ($4.64), and Kenya ($5.40).
- The Relative Reality: When these dollar figures are weighed against local GDP per capita, the hierarchy inverts. On a standardized 0-to-100 Netflix Index—where higher scores indicate a heavier financial sacrifice relative to local income—nations like Afghanistan (100.0), the Central African Republic (95.5), and Malawi (95.3) occupy the peak.
- The Minimalist Burden: At the opposite end of the relative spectrum, affluent microstates and territories like Monaco (0.0), Bermuda (5.9), and Macao (8.9) find subscription costs to be virtually negligible—amounting to little more than a rounding error against average local incomes.
The central takeaway is clear: while Netflix scales down its absolute dollar prices in poorer countries, it fails to scale them down proportionally to the drop in local incomes. Consequently, the true financial burden of streaming falls disproportionately on low-income populations.
Chronology and Methodology: How the Index Was Built
To rigorously test whether Netflix’s regional pricing achieves true "fair price differentiation," quantitative economist and postdoctoral researcher Colin von Negenborn constructed a comprehensive data pipeline. The methodology bridges web scraping, financial API integration, and geographic data science in three distinct phases.
Step 1: Data Acquisition and Preparation
Gathering comparative metrics across more than 200 countries required pulling information from four major pillars:
- Netflix Pricing Data: Because Netflix operates in over 200 countries with unique pricing structures, manual data collection was impractical. Custom Python web-scraping scripts were deployed to scan Netflix’s regional portals. Out of 249 territories, standard plan prices were successfully extracted for 245. (China, North Korea, Russia, and Syria were excluded due to a lack of service availability).
- Financial & Exchange Rate Data: To compare prices across borders, raw local currencies (such as 800 rupees or 231,000 Vietnamese dong) had to be converted into US dollars. Daily exchange rates were pulled via automated extraction from the European Central Bank (ECB), supplemented by scraping XE.com for smaller economies. Note: Argentina was entirely removed from subsequent analysis due to hyperinflation and severe exchange-rate instability that produced distorted, implausible USD values exceeding $250 per month.
- Economic Data (GDP per Capita): To evaluate purchasing power, the project integrated World Bank economic data via its application programming interface (API). GDP per capita was selected as the baseline metric to measure a country’s average economic output and living standards relative to its population size.
- Geographical Data: Official United Nations geospatial boundary files were mapped to the dataset using standard ISO country codes, allowing for clean, uniform visualizations via choropleth maps.
Step 2: Normalization and Index Construction
With USD prices and GDP per capita figures aligned, the relative cost for each country ($i$) was calculated using the ratio:
$$textRelative Price_i = fracp_i^$y_i$$

Where $p_i^$$ represents the Netflix Standard-plan price in US dollars, and $y_i$ represents the GDP per capita.
To transform this raw ratio into a clean, interpretable metric, two final statistical steps were taken:
- Skewness Reduction: Burundi—possessing the dataset’s lowest GDP per capita paired with a standard $7.99 subscription—produced an extreme statistical outlier and was removed. A logarithmic transformation was then applied to the remaining data to compress the right tail, ensuring a more symmetric distribution.
- Min-Max Scaling: Finally, a min-max scaler mapped the log-transformed values onto a scale from 0 to 100, creating the final Netflix Index.
Step 3: Visualization
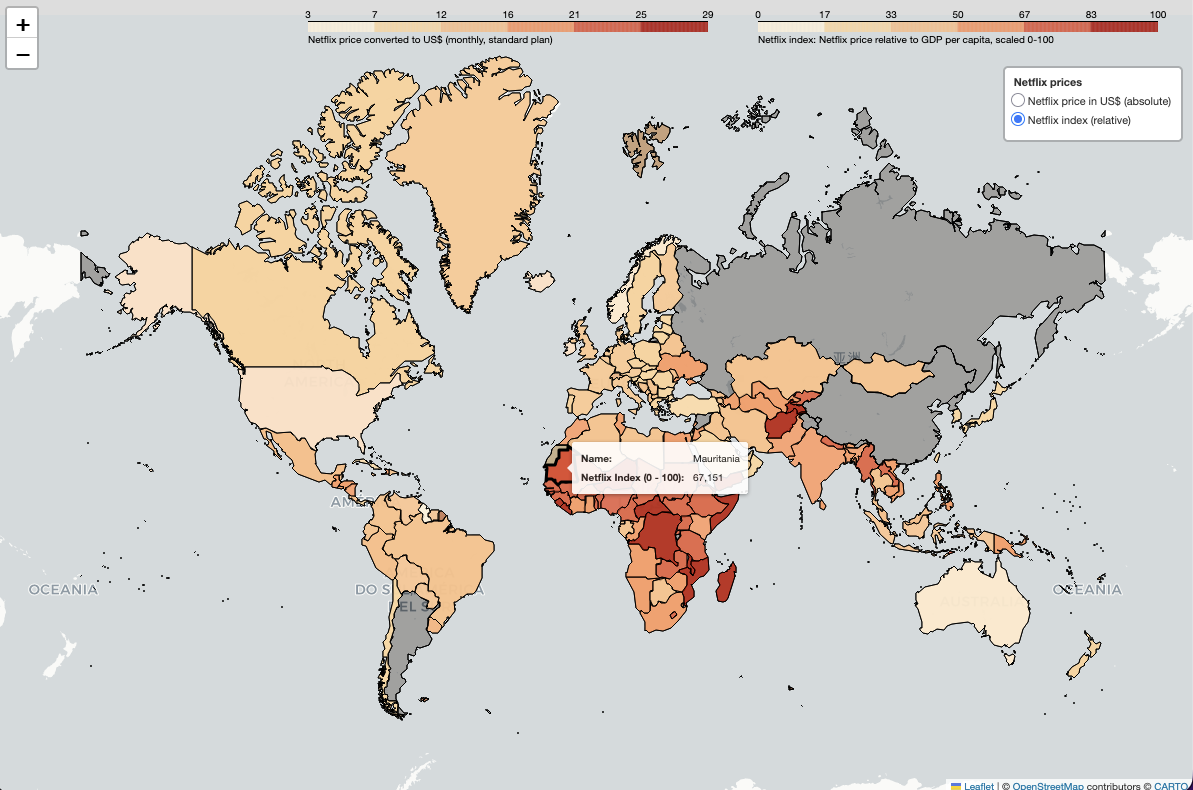
The resulting data was rendered into dual-format visualizations: static side-by-side choropleth maps built with Python’s Matplotlib library, and an interactive web map built using the Folium library accessible here. The interactive map allows users to toggle seamlessly between absolute dollar costs and the relative Netflix Index, visually demonstrating how the global landscape shifts when purchasing power is considered.

Supporting Data: The Visual and Numerical Divergence
The analytical output challenges conventional wisdom regarding corporate pricing equity. When mapped visually, the contrast is stark:
- The Absolute Map: Shaded in gradients of dark red, the absolute price map highlights the Global North. North America, Western Europe, and Australia dominate the darkest tiers, signaling high nominal outlays.
- The Relative Map: When shifted to the Netflix Index, the color gradient completely inverts. Sub-Saharan Africa, South Asia, and parts of Southeast Asia emerge as the darkest regions on the map, while high-income hubs fade into the lightest shades.
A scatter plot comparing monthly USD prices against GDP per capita reveals an upward-sloping regression line—confirming that Netflix does indeed charge more in richer countries. However, the slope is remarkably shallow. Economic output and average incomes rise at an exponential rate compared to the linear, highly constrained adjustments Netflix makes to its regional subscription fees.
Official Responses and Market Context
Streaming giants like Netflix rarely publish granular justifications for their localized pricing tiers, instead framing regional adjustments as a mechanism for expanding accessibility in developing digital markets. Industry analysts note that subscription video-on-demand (SVOD) pricing must navigate a delicate equilibrium: setting prices low enough to penetrate emerging markets like India, Pakistan, or Sub-Saharan Africa while maintaining high ARPU (Average Revenue Per User) in mature markets like the United States and Western Europe to satisfy Wall Street investors.

However, consumer advocacy groups and economic researchers argue that these adjustments remain insufficient. By tethering regional pricing loosely to local GDP without accounting for stark income inequality within those developing nations, platforms risk pricing out the very middle-class demographics they target for international growth.
Implications: Inequality in the Digital Economy
The implications of the Netflix Index extend far beyond the streaming industry, touching on broader questions of digital globalization, corporate social responsibility, and economic equity.
- The Regressive Nature of Global Digital Goods: Digital products have near-zero marginal costs of reproduction. While physical goods must account for localized supply chains, shipping tariffs, and manufacturing overhead, digital subscriptions carry no such constraints. Charging consumers in developing economies a vastly higher percentage of their disposable income for an identical digital bitstream raises ethical questions about global digital access.
- Income Distribution Blind Spots: Because the study relies on country-level GDP per capita averages, the reality on the ground in nations like Afghanistan, Nigeria, or Pakistan is likely even more pronounced. In economies with high wealth concentration, the median income is often significantly lower than the GDP per capita average, meaning a standard Netflix subscription may consume an even larger share of a typical household’s budget than the index suggests.
- A Blueprint for Future Economic Audits: Beyond entertainment, this methodological framework provides a blueprint that can be replicated for other global digital services—such as Spotify, cloud storage providers, or software-as-a-service (SaaS) platforms. Future research building on this pipeline could track how these relative pricing burdens evolve over time amid global inflationary pressures.
Ultimately, the Netflix Index serves as a reminder that nominal price reductions do not automatically equate to economic relief. As streaming platforms continue to seek their next phase of international expansion, the pressure will mount on corporate leaders to align their pricing algorithms not just with national borders, but with the lived financial realities of everyday consumers.
 Azzam Bilal Chamdy
 Asep Darmawan
 Suro Senen
