
 By Pevita Pearce
By Lauriane Mouysset
Research Director, CNRS; Textile Artist & Data Visualization Creator
Main Facts
When contemporary art, digital media, and rigorous scientific research collide, the friction can generate profound insights—or reveal uncomfortable blind spots. In February 2025, I launched my first digital data visualization, titled "À sa place" ("In Her Place"), designed to accompany my contemporary textile installation "Guerrières" at the Pavillon Vendôme art center in Clichy, France.
The project was born out of a dual identity: I serve as a research director at the French National Centre for Scientific Research (CNRS), studying the biodiversity crisis at the intersection of ecology, economics, and philosophy, while also working as a textile artist under the banner of Mouysset Studio and an ambassador for the French association Femmes & Sciences. "Guerrières" featured embroidered portraits of historically overlooked women scientists, overlaid with colorful masks stitched directly onto vintage black-and-white photographs. To bridge the physical gallery space with contemporary digital habits—particularly to engage tech-savvy teenage visitors—I built an interactive data visualization accessed via a QR code.
The core mission of "À sa place" was to demonstrate how gender bias operates in the scientific community by comparing Wikipedia page-view metrics between male and female scientific peers. However, the initial rollout on February 11, 2025—timed deliberately for the International Day of Women and Girls in Science—revealed a stark reality: while the visualization possessed gallery-ready aesthetic elegance, it failed to circulate organically on social media. It was too cryptic, relying on artistic ellipsis rather than clear, punchy argumentation.
This initial failure forced a comprehensive redesign. More importantly, the discipline required to make the visualization legible compelled me to re-analyze the underlying data itself. What began as a quest for viral clarity ultimately exposed a sobering truth: historical gender bias in science does not correct itself organically. True parity and audience recovery occur exclusively where targeted, recent public acts of visibility—such as a major film, a prestigious prize, or a commemorative stamp—have deliberately broken the silence.

Chronology of a Project: From Thread to Code
To understand how an art piece transformed into a methodological data inquiry, one must trace the chronology of its development from concept to public release and subsequent redesign.
Fall 2024: Conception and Curation
Invited to exhibit my embroidered portraits at the Pavillon Vendôme in Clichy for a group show running from February 17 to May 2, 2025, I wanted to expand the project beyond visual aesthetics. I sought to deliver an explicit message regarding the systemic invisibility of women in science. Concurrently, I began experimenting with data visualization, seeking a quantitative parallel to my textile work.
February 11, 2025: Early Digital Launch
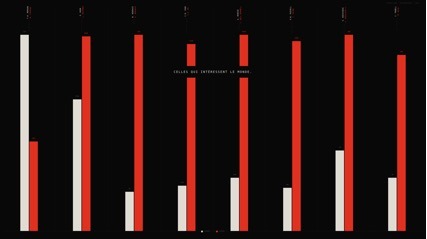
Seeking to seed civic circulation beyond the physical walls of the gallery, I published the first iteration of "À sa place" online six days prior to the physical exhibition’s opening. This timing capitalized on media attention surrounding the International Day of Women and Girls in Science. The first version relied on eight pairs of male and female scientific cosignatories, utilizing Wikipedia page views to highlight disparities.
February 17, 2025: Exhibition Opening and Feedback
The exhibition opened at the Pavillon Vendôme, featuring a QR code centrally positioned among the embroidered portraits. While gallery visitors engaged with the physical-digital hybrid, feedback from family, peers, and opening-night attendees was unanimous: the piece was visually striking but intellectually cryptic. Viewers could not immediately grasp the argument. It was optimized for the slow, contemplative gaze of a museum visitor, rendering it useless for the fast-paced, high-turnover ecosystem of social media feeds.
February–March 2025: The Redesign and Data Audit
Confronted with the failure of the piece to virally circulate, I initiated a rigorous redesign process spanning 10 formal iterations. This technical and editorial overhaul required abandoning artistic ellipsis in favor of direct, sequenced storytelling. In doing so, I audited the dataset, weeded out false positives and low-volume anomalies, expanded the corpus to 10 distinct pairs, and uncovered the definitive correlation between public acts of visibility and historical recovery.
Supporting Data: The Anatomy of Scientific Erasure
The redesign of "À sa place" required transitioning from shallow assumptions about "recovering" women scientists to an empirical examination of what drives public attention.
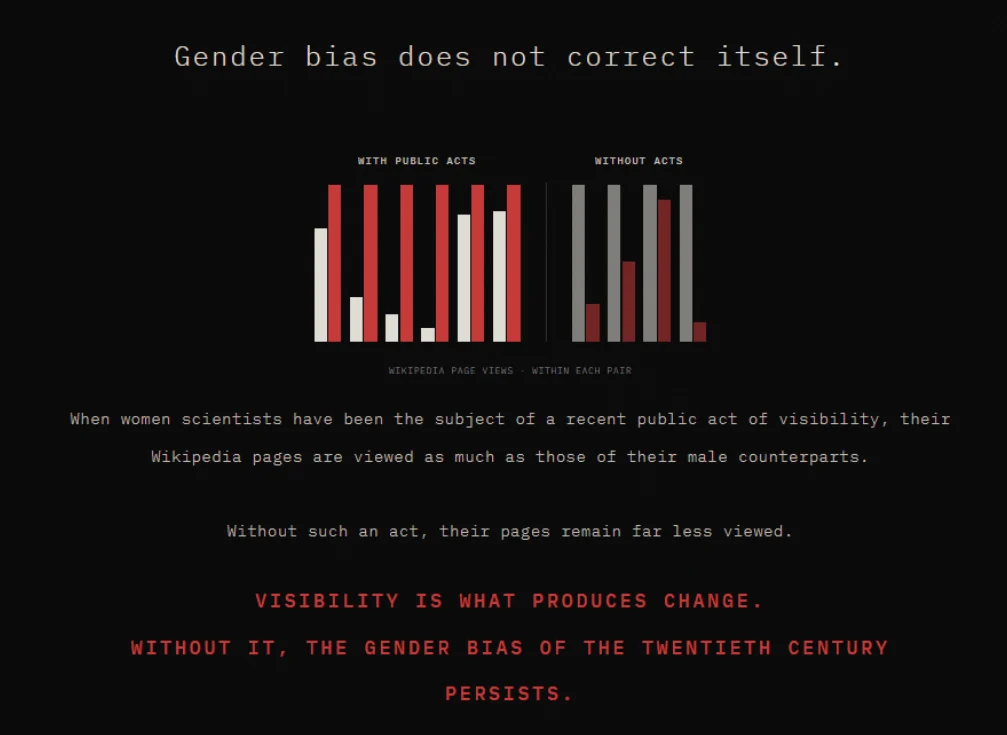
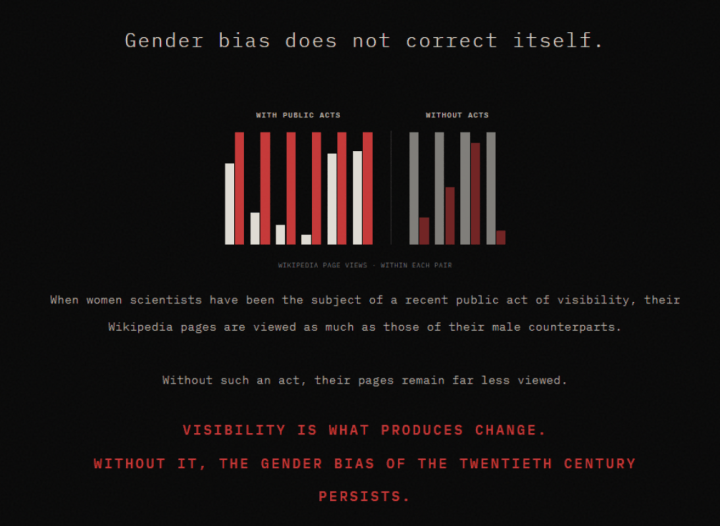
Initially, I conceptualized the project around the theme of "erasure," imagining an animation where women’s names faded over time. Seeking rigorous metrics, I turned to Wikipedia data—specifically annual English-language Wikipedia page views retrieved via the Wikimedia Pageviews Analysis API between July 2015 and December 2025. By calculating the female-to-male (F/M) ratio of average annual page views within matched pairs of scientific collaborators or contemporaries, a distinct structural pattern emerged.
The Final Corpus of 10 Pairs
| Woman | Man | Recent Public Act of Visibility | F/M Ratio (Page Views) |
|---|---|---|---|
| Katherine Johnson | John Glenn | Hidden Figures (film, 2016) | × 1.2 |
| Jocelyn Bell Burnell | Antony Hewish | Breakthrough Prize (2018) | × 5.7 |
| Cecilia Payne | Henry Norris Russell | Google Doodle (2019) | × 11.6 |
| Chien-Shiung Wu | Chen-Ning Yang | US postal stamp (2021) | × 3.5 |
| Rosalind Franklin | James Watson | ESA rover (2019) | × 1.2 |
| Lise Meitner | Otto Hahn | Meitnerium (1997), 150th birthday (2023) | × 1.4 |
| No Recent Public Act | |||
| Kathleen Lonsdale | John Desmond Bernal | None | × 0.9 |
| Marthe Gautier | Jérôme Lejeune | None | × 0.24 |
| Esther Lederberg | Joshua Lederberg | None | × 0.5 |
| Marguerite Perey | Glenn Seaborg | None | × 0.13 |
Methodological Note: Page views represent annual totals for English-language Wikipedia articles (July 2015–December 2025). The F/M ratio reflects the woman’s average annual page views divided by the man’s; values above 1 indicate the woman’s page is viewed more frequently. Full code and data repositories remain accessible at lauriane-mouysset.fr/a-sa-place/.
The Power of Intentional Visibility
The empirical findings challenge comforting narratives of natural societal progress. Across all 10 pairs in the final dataset, the rule admits zero exceptions:
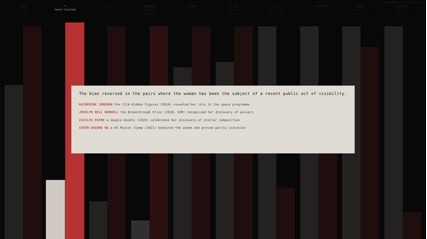
- The With-Act Group (6 Pairs): Every single pair featuring a woman who has been the subject of a targeted, recent public act of visibility results in a complete reversal of historical obscurity. Women like Cecilia Payne (boosted by a 2019 Google Doodle) and Jocelyn Bell Burnell (recognized via the 2018 Breakthrough Prize) now outpace their male counterparts significantly in contemporary digital attention.
- The Without-Act Group (4 Pairs): Conversely, pairs where no prominent public act of visibility occurred (such as Marguerite Perey or Marthe Gautier) show severe marginalization, with F/M ratios plummeting as low as 0.13.
Lise Meitner’s case provides a fascinating nuance: her F/M ratio is a modest × 1.4, directly correlated to the temporal distance of her public recognition (the chemical element meitnerium was named in 1997, supplemented by a quiet 150th birthday commemoration in 2023). This demonstrates that the freshness of public visibility acts as a critical decay factor in digital retention.

Official Responses and Cross-Disciplinary Perspectives
The intersection of feminist data visualization, institutional science, and contemporary art has drawn significant commentary from academic and cultural spheres.
Speaking on the motivations behind the project, institutional bodies have increasingly emphasized the necessity of bridging hard data with civic engagement. Representatives from Femmes & Sciences noted that breaking down entrenched gender stereotypes in STEM fields requires moving beyond traditional academic papers into public-facing art and accessible digital formats.
From a data-feminism framework—informed heavily by the scholarship of Catherine D’Ignazio and Lauren Klein—"À sa place" embodies the core tenet that data visualization is never neutral; it is an active exercise in power relations. By explicitly distinguishing between scholarly documented cases of undercrediting (such as Margaret Rossiter’s documentation of the "Matilda effect" or Anne Sayre’s work on Rosalind Franklin) and purely data-driven observations, the project bridges the gap between empirical historical research and intuitive public communication.
Art critics at the Pavillon Vendôme exhibition similarly observed that embedding digital interactive elements within physical textile installations creates a vital pedagogical bridge, transforming teenage museum-goers from passive spectators into active investigators of historical inequality.
Implications: The Dramaturgy of Political Data Viz
The failure of the initial digital release and the subsequent successful redesign offer profound methodological implications for artists, data scientists, and political communicators alike.
1. The Clash of Two Regimes
A political data visualization attached to a contemporary art installation operates at the friction point of two fundamentally incompatible regimes:
- The Regime of Art: Values ellipsis, slowness, ambiguity, and the quiet unfolding of layered meanings. It thrives in physical galleries where viewers invest uninterrupted time.
- The Regime of Digital Media: Demands immediate clarity, structured narration, and explicit messaging. Because civic circulation and virality are prerequisites for political impact, ambiguity equals erasure.
My experience demonstrates that the artistic regime must yield. A clear, visually restrained data visualization can retain artistic integrity, whereas a cryptic data visualization ceases to function politically.
2. Clarity as an Investigative Tool
Initially, I approached clarity merely as a packaging mechanism—a way to translate existing concepts for social media. However, the rigorous discipline required to make "À sa place" readable fundamentally reshaped the underlying data. Eliminating false positives (such as Nettie Stevens’ outlier peak or Marietta Blau’s low-volume volatility), refining the groupings, and structuring the narrative into two distinct movements ("the system" followed by "the individuals") revealed patterns that artistic elegance had previously concealed.
Clarity is not merely a tool for communication; it is an instrument of inquiry.
3 A New Hybrid Grammar
"À sa place" serves as the foundational prototype for an ongoing series of hybrid textile-digital projects currently in development. Future installations will maintain this dual structure: an embroidered physical artwork that evokes memory and emotion on an intimate scale, paired with a digitally optimized, radically clear data visualization engineered for civic circulation.
By embracing this tension, creators working at the intersection of art and social justice can forge a new grammar—one where emotional resonance and empirical clarity unite to drive genuine cultural change.
 Azzam Bilal Chamdy
 Asep Darmawan
 Suro Senen
