 By Reynand Wu
In the fast-paced world of digital marketing, superficial metrics can easily deceive. While a high follower count or millions of impressions may look impressive on a surface-level quarterly report, they reveal little about whether an audience actually cares about a brand’s message. Enter the engagement rate—the definitive litmus test for online resonance.

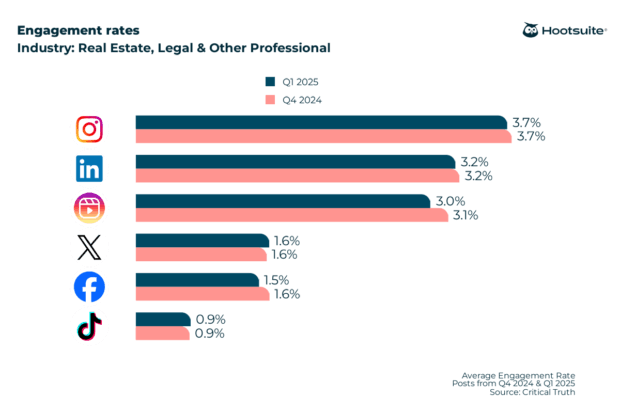
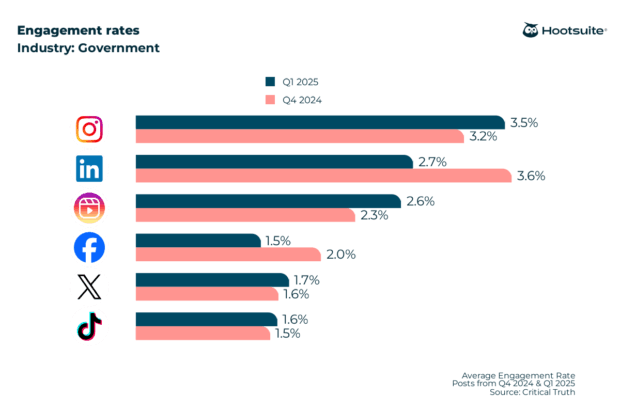
Recent industry analysis has mapped out the social media landscape, charting engagement rates across 13 distinct sectors and major platforms including Instagram, TikTok, LinkedIn, and Facebook. The findings challenge long-held assumptions about where brands should focus their efforts, highlighting how different platforms and industries perform in an increasingly crowded digital ecosystem.

Main Facts: Understanding the Core Metrics
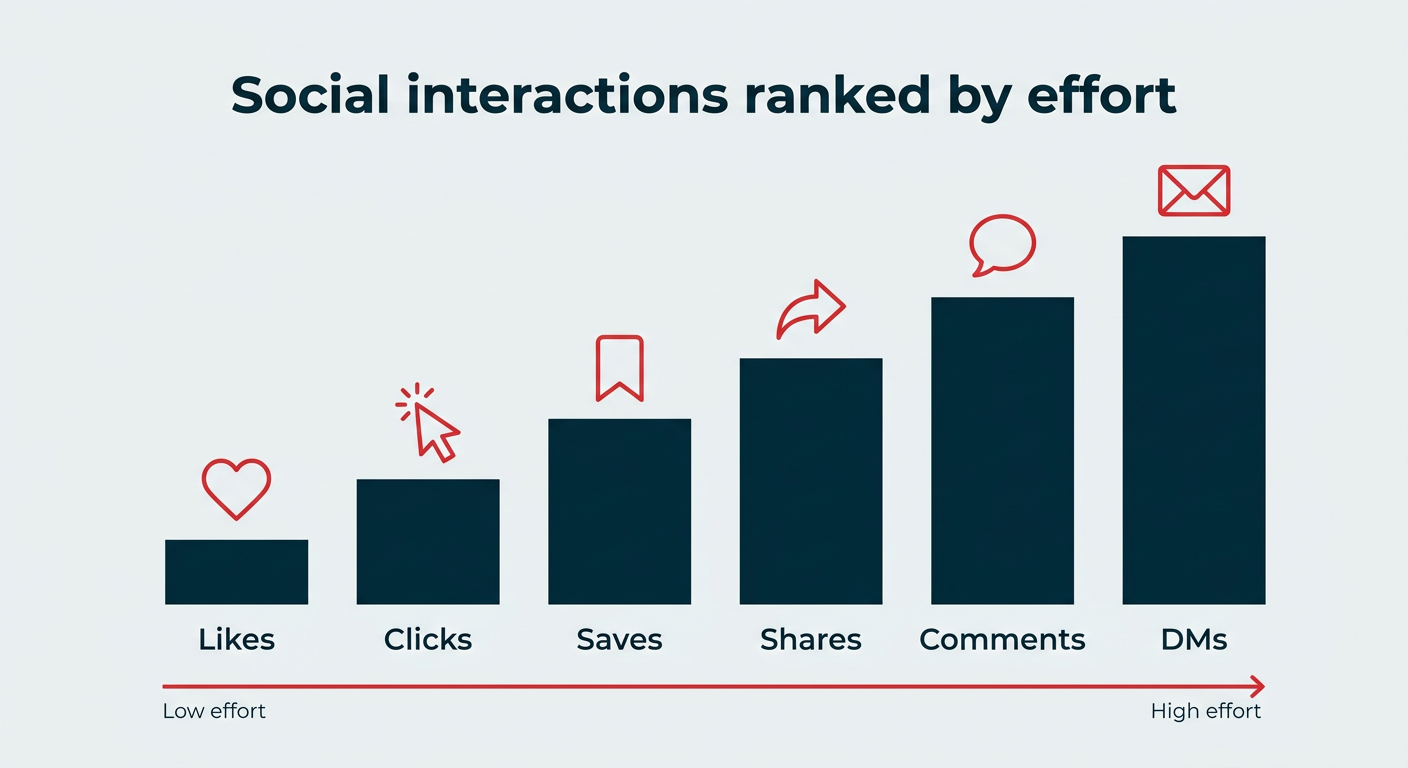
At its core, a social media engagement rate measures the percentage of an audience that actively interacts with a piece of content rather than merely scrolling past it. Calculated by dividing total interactions (likes, comments, shares, and saves) by a measure of audience size—such as followers, reach, or impressions—and multiplying by 100, this metric captures the true quality of audience attention.
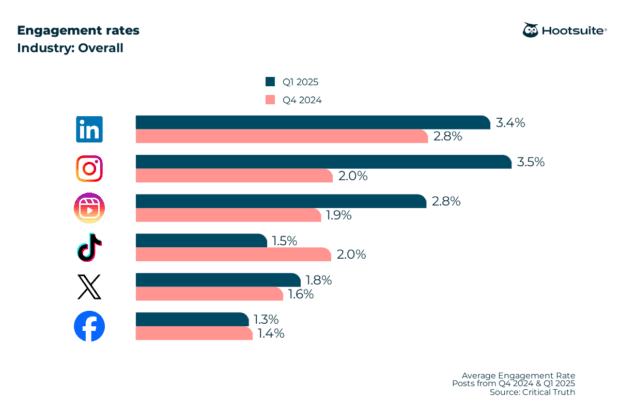
Across the digital landscape, a "good" engagement rate generally hovers between 1% and 5%, though this varies drastically by platform and industry.
- Instagram continues to lead the pack as the highest-performing platform overall, averaging a 4.2% engagement rate.
- LinkedIn follows closely behind at 3.9%, experiencing a steady year-over-year rise that surprises many marketers who previously relegated it to a secondary status.
- Facebook records an average of 2.9%, heavily influenced by strict organic reach caps for brand pages.
- X (formerly Twitter) averages 1.8%.
- TikTok sits at the lower end of the general spectrum with an average of 1.5%, reflecting the unique challenges brands face when trying to convert entertainment-driven algorithms into measurable engagement.
Chronology and Industry Evolution: How Sectors Stack Up
The digital marketing landscape has evolved from a simple "post and pray" philosophy to a nuanced, platform-specific science. Over recent years, brands have learned that audience expectations vary wildly depending on the sector they operate in.
When evaluating average engagement rates by industry, performance ranges from a modest 0.7% to a robust 5.5%. Sectors relying heavily on visual storytelling, community alignment, and mission-driven content consistently outpace traditional retail and media corporations.
1. The Frontrunners: Construction, Education, and Nonprofits
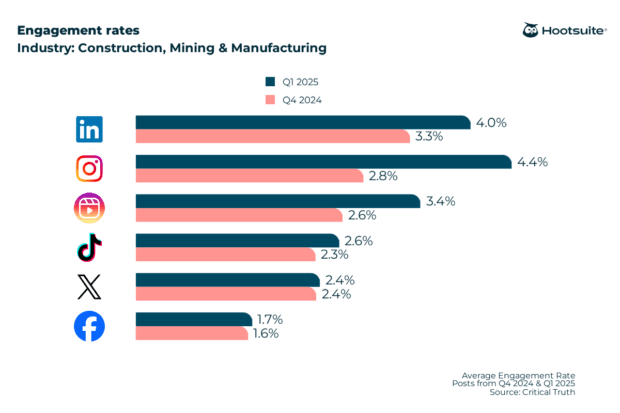
Sectors like construction, mining, and manufacturing have unlocked the power of video-first platforms, leading TikTok with a 2.6% engagement rate and hitting 5.2% on Instagram through raw, fascinating process footage and heavy machinery reveals.
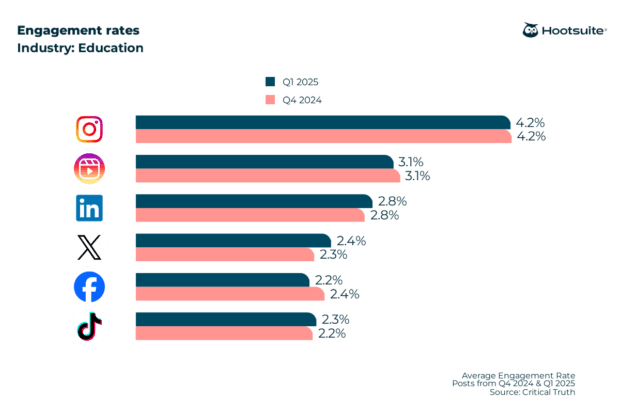
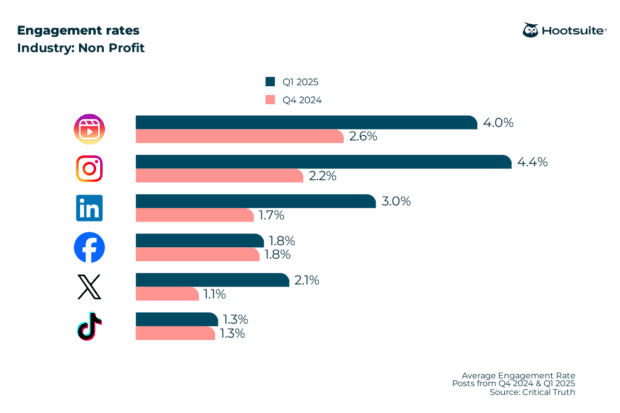
Meanwhile, education and nonprofit sectors dominate the top tiers. Nonprofits lead Instagram engagement at 5.5% (tied with utilities and energy), proving that emotionally resonant, mission-driven storytelling triggers the exact saves and shares that algorithms reward. Education similarly excels across platforms, boasting a 5.4% rate on Instagram and an industry-high 5.2% on Facebook, fueled by built-in communities of eager students, proud parents, and engaged alumni.
2. The Mid-Tier Players: Finance, Healthcare, and Professional Services
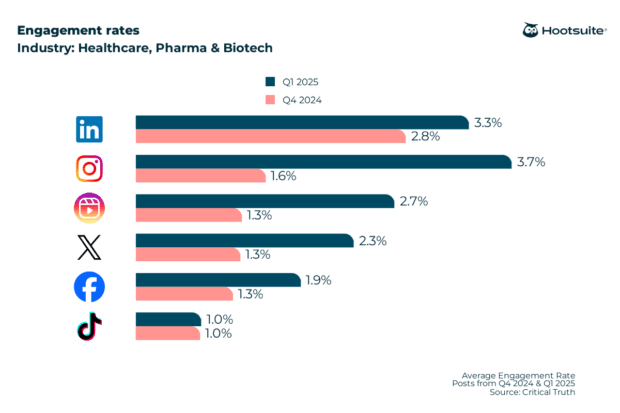
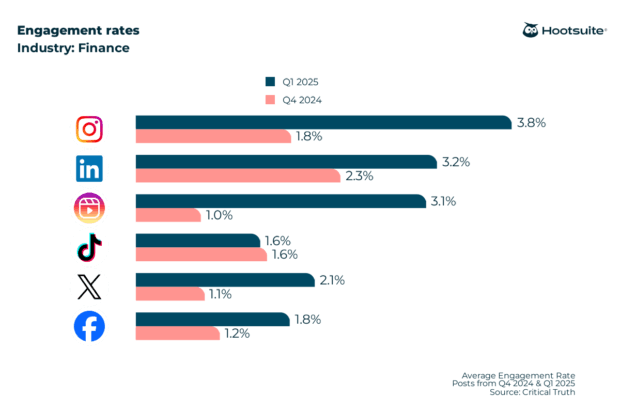
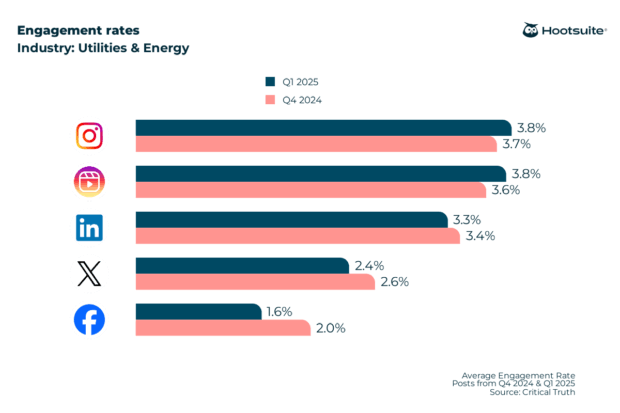
Highly regulated and technical sectors are performing far better than conventional wisdom suggests. Financial services secures a 4.1% rate on Instagram and 3.3% on LinkedIn, driven by practical money advice that users naturally bookmark and share. Healthcare, pharma, and biotech achieve solid results on Instagram (4.5%) and LinkedIn (3.4%), capitalizing on a high public demand for trustworthy health information, though they struggle on TikTok (1.0%) due to strict regulatory hurdles. Utilities and energy match nonprofits at the top of Instagram with 5.5%, using short video explainers to demystify complex service updates.
3. The Challenged Sectors: Retail, Tech, and Media
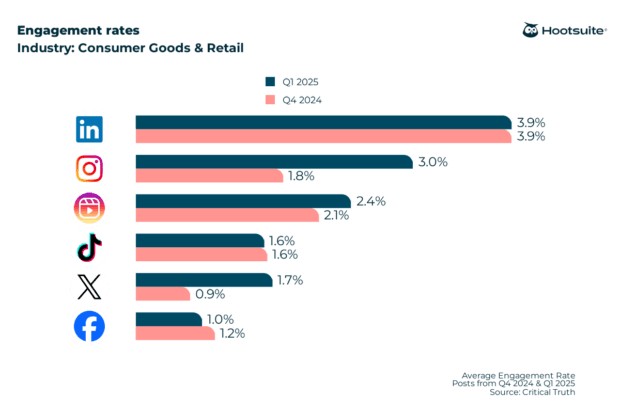
Consumer-facing brands face unique headwinds. Consumer goods and retail perform unexpectedly well on LinkedIn (4.3%) via supply chain and leadership discussions, but dip to 1.9% on Facebook. Technology and marketing agencies find mixed results; while tech leads X at 2.5%, both sectors see suppressed numbers on TikTok (0.7%). Finally, media and entertainment brands post below-average results on Instagram (3.2%) and Facebook (2.6%), where a high volume of posting dilutes engagement across massive follower bases.
Supporting Data: The Three Calculation Methods
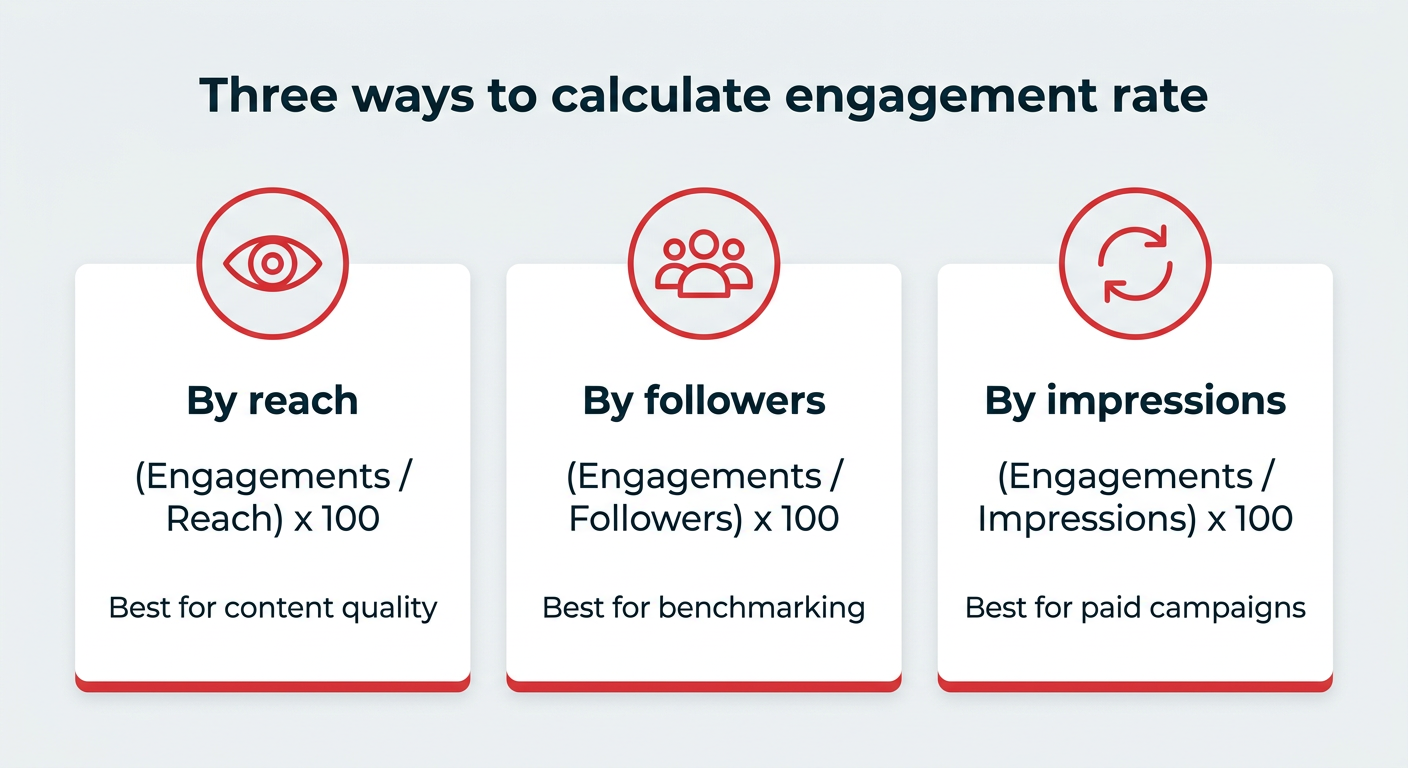
Marketers cannot effectively optimize their strategies without understanding how their metrics are computed. Depending on the analytical goal, professionals typically rely on three distinct engagement formulas:
- Engagement Rate by Reach:
(Total Engagements / Reach) x 100- Best Use: Determining the true compelling power of a piece of content, as it only accounts for individuals who actually viewed the post.
- Engagement Rate by Followers:
(Total Engagements / Followers) x 100- Best Use: Standard industry benchmarking and macro-comparisons against published averages.
- Engagement Rate by Impressions:
(Total Engagements / Impressions) x 100- Best Use: Paid advertising campaigns where frequency and repeated views matter.
Furthermore, context is everything. An engagement rate of 12% on Instagram is not just good—it is exceptional. However, it almost always belongs to a smaller, hyper-niche account with a fiercely loyal audience or a single viral post that broke out far beyond its core follower base.
Official Responses and Industry Insights
Industry analysts and platform experts have synthesized several vital takeaways from the latest benchmark data:
- Production Budget Doesn’t Equal Engagement: A low-fidelity, authentic phone-shot Reel with a genuine human narrative frequently outperforms a glossy, high-budget corporate commercial.
- The Rise of B2B Professional Channels: LinkedIn’s 3.9% overall engagement rate proves it is no longer just a digital resume repository. For B2B organizations, it serves as a primary hub for substantive dialogue without the fierce noise of consumer entertainment platforms.
- TikTok’s Targeting Paradox: Because TikTok’s recommendation engine relentlessly serves content to non-followers seeking entertainment, brand-centric messaging often falls flat. Organizations must tailor their content to feel native to the culture of the platform rather than acting as a traditional billboard.
Implications for Future Marketing Strategy
The widening gap between platform averages and industry performances carries profound implications for marketing leaders navigating the digital space.
First, businesses must abandon vanity metrics. Chasing raw follower growth without monitoring engagement quality leads to bloated accounts with silent audiences. Brands must pivot toward a philosophy of producing fewer, higher-quality posts tailored to a tightly defined target demographic.
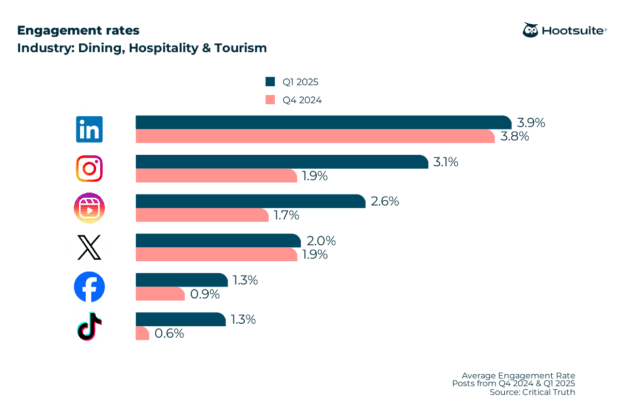
Second, resource allocation must shift. Rather than spreading marketing teams thin across every emerging app, organizations should double down on the channels where their audience actively participates—such as leveraging LinkedIn for B2B tech or prioritizing Instagram for visually dynamic consumer goods and nonprofits.
Ultimately, understanding engagement benchmarks allows modern brands to stop guessing and start building data-driven strategies that turn passive scrollers into active, loyal brand advocates.
 Ammar Sabilarrohman
 Jia Lissa
 Muslim
