
 By Suro Senen
In the rapidly evolving landscape of digital marketing, the ability to translate data into strategy is no longer just a skill—it is a survival requirement. As we approach 2026, CMOs and social media managers are facing increased pressure to justify marketing spend, with revenue growth remaining the top priority for leadership. To navigate this, professionals must move beyond "vanity metrics" and adopt a rigorous, KPI-driven approach to social media measurement.
This guide explores the 25 essential metrics that will define social media performance in 2026, providing the framework needed to prove impact, optimize content, and drive tangible business growth.

The Strategic Foundation: Metrics vs. KPIs
A fundamental error in modern digital strategy is the conflation of metrics and Key Performance Indicators (KPIs). Metrics are the raw data points—the "what happened" of your social activity, such as impressions, likes, or clicks. KPIs, by contrast, are the strategic benchmarks that tie those metrics to broader business goals.
For example, tracking "impressions" is a metric. A KPI would be: "Increase brand awareness among 25-34-year-olds by 15% this quarter." Every KPI is constructed using metrics, but a metric without a goal is merely noise. By aligning your tracking with the 70/20/10 rule—where 70% of content provides value, 20% is curated, and 10% is promotional—you can assign specific metrics to specific phases of the customer journey, ensuring that your reporting serves the bottom line.

Chronology of Measurement: From Awareness to Advocacy
Effective measurement follows the funnel. By categorizing your tracking efforts, you can gain a clearer picture of how a user moves from an initial impression to a loyal customer.
Phase 1: Awareness (Reach & Impressions)
In the early stage, your goal is visibility.
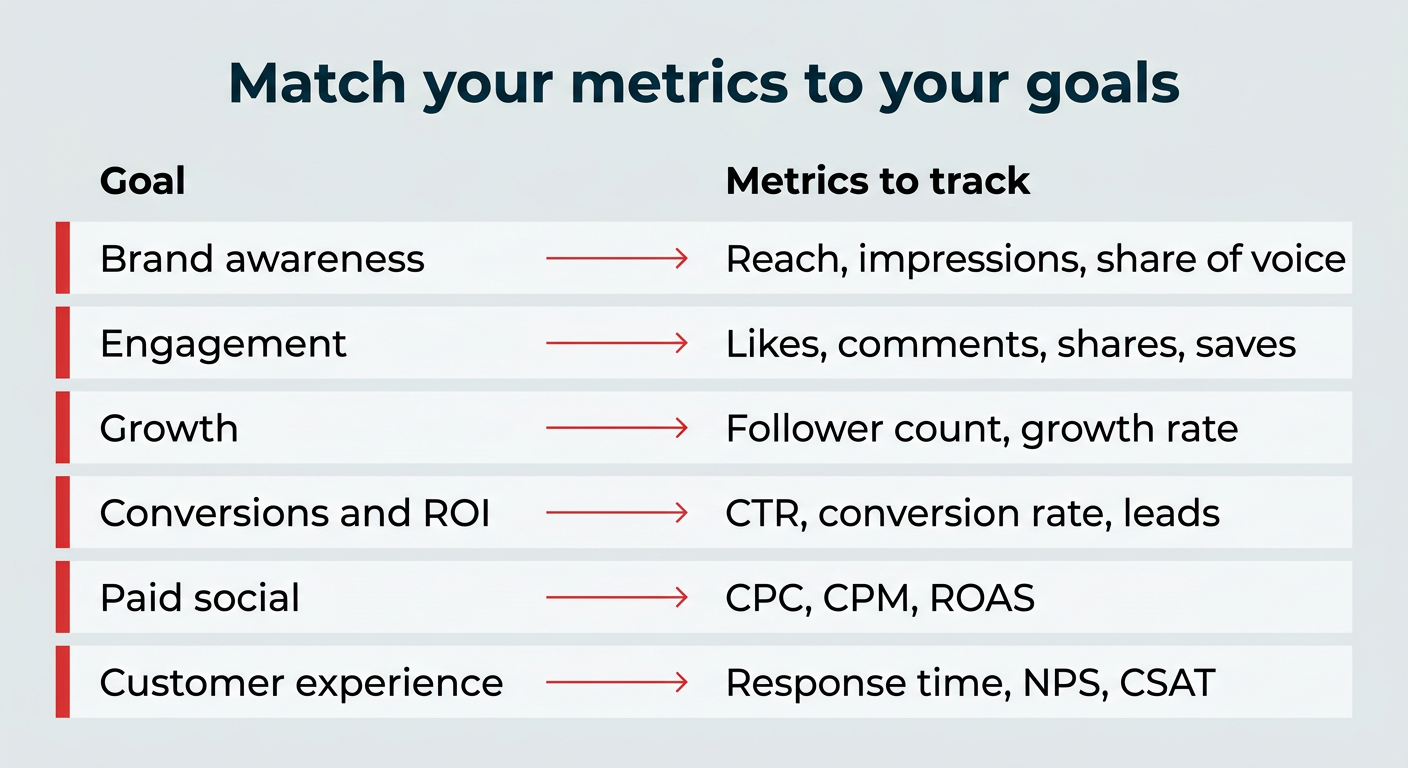
- Reach: The total number of unique accounts that saw your content.
- Impressions: The total frequency of your content appearing on screens, including repeat views.
- Social Share of Voice (SSoV): A competitive intelligence metric that calculates your brand’s presence relative to the entire industry conversation.
Phase 2: Engagement (Resonance)
Once you have visibility, you need to measure depth.
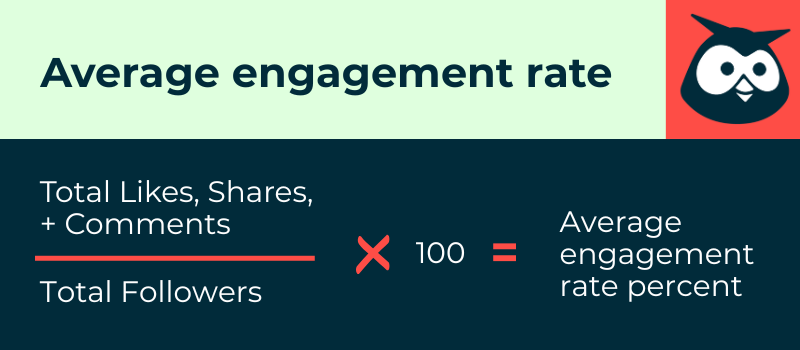
- Engagement Rate: Calculated by dividing total interactions (likes, comments, shares, saves) by total followers.
- Saves: The ultimate high-intent metric. A save indicates that a user found your content valuable enough to revisit, which heavily influences algorithmic favorability.
Phase 3: Conversion (Impact)
This is where social media proves its worth in dollars.
- Conversion Rate: The percentage of users who clicked a link and performed a desired action (purchase, sign-up, download).
- Click-Through Rate (CTR): The efficiency of your call-to-action (CTA).
- Referral Traffic: Using UTM parameters to track exactly which social posts are funneling traffic to your website.
Supporting Data: Why Definitions Matter
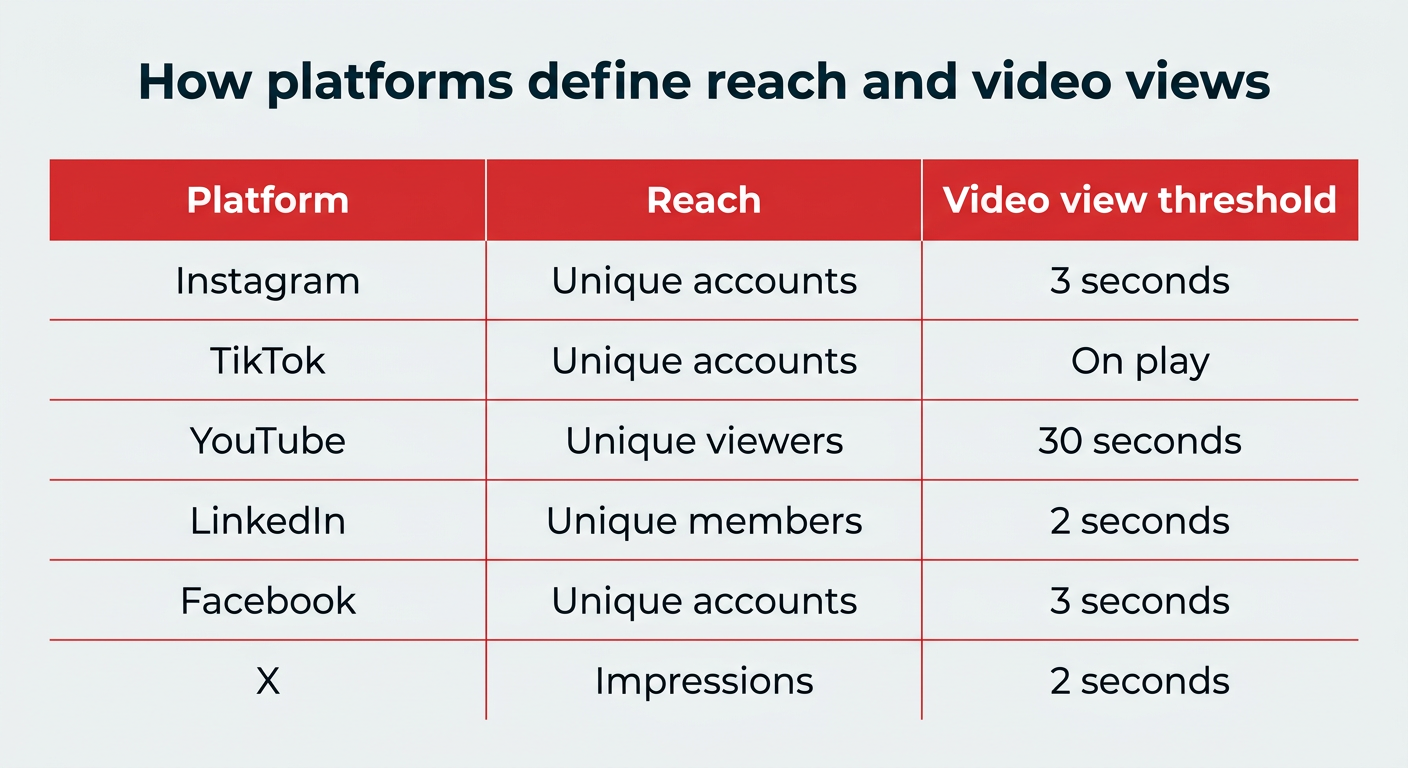
One of the greatest challenges in 2026 is the lack of universal definitions across platforms. A "view" on TikTok is not the same as a "view" on YouTube.
| Platform | Reach Definition | Video View Threshold |
|---|---|---|
| Unique accounts | 3 seconds | |
| TikTok | Unique accounts | As soon as it starts |
| YouTube | Unique viewers | 30 seconds |
| Unique members | 2 seconds (50% in view) |
Failing to account for these nuances leads to flawed comparisons. When benchmarking your performance, always normalize your data by platform-specific definitions to avoid drawing inaccurate conclusions.
Official Perspectives: The Shift Toward Paid and Search
With nearly 32% of U.S. digital ad spending now allocated to social networks, the shift toward performance-based metrics—such as Return on Ad Spend (ROAS) and Cost Per Click (CPC)—is irreversible.
Furthermore, social platforms are increasingly functioning as search engines. Gen Z, in particular, now uses platforms like TikTok and Instagram as primary discovery tools, bypassing traditional search engines like Google. Consequently, Social Search Visibility—tracking how your brand ranks for specific keywords within social platforms—has emerged as a critical KPI for 2026.
The 25 Essential Metrics Checklist
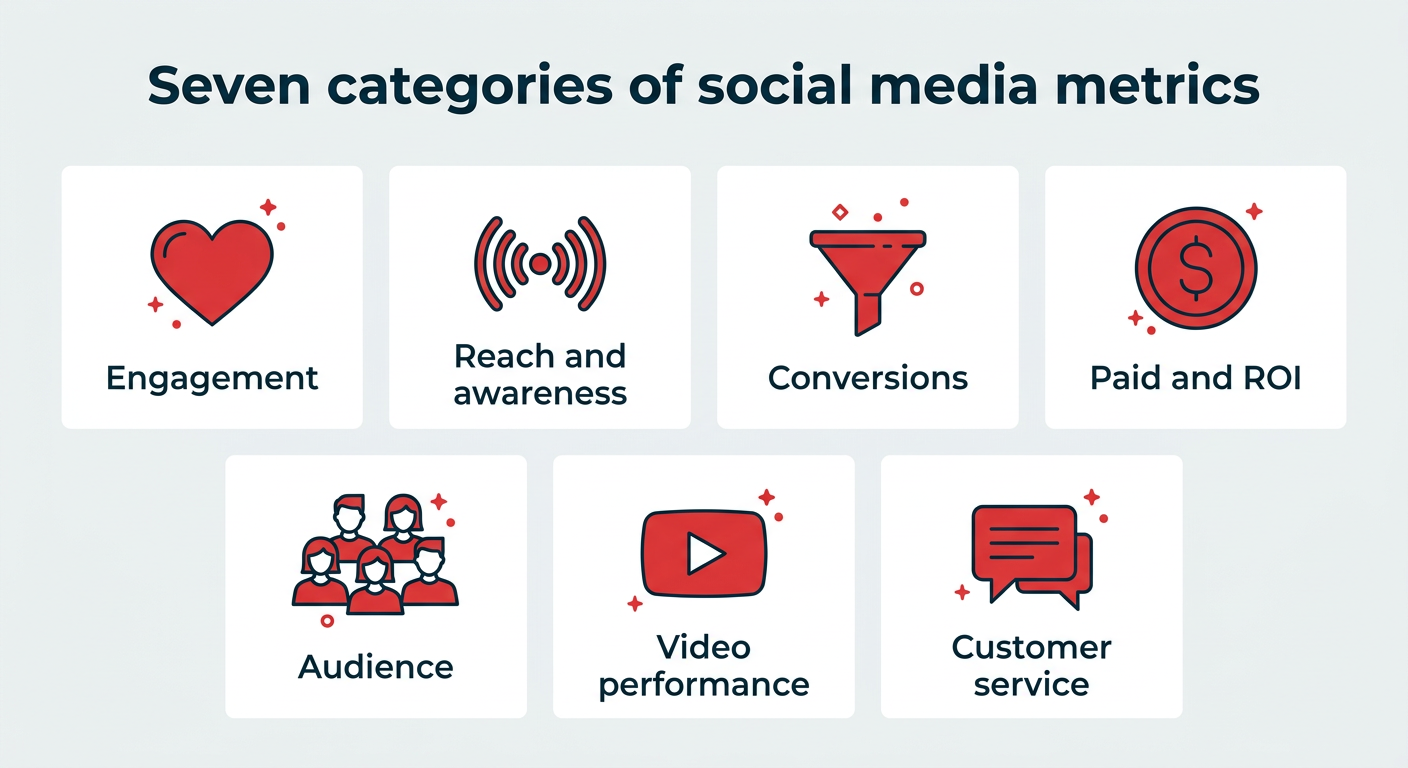
To manage your strategy effectively, categorize your metrics into these five core pillars:
1. Engagement Metrics
- Engagement Rate: The primary indicator of resonance.
- Likes/Reactions: The quick-read sentiment signal.
- Comments: Deep qualitative feedback.
- Shares: The "endorsement" metric; indicates high-value, informative content.
- Saves: The bookmarking metric, signaling utility and long-term interest.
2. Reach & Awareness
- Reach: Audience size.
- Impressions: Content frequency.
- Social Share of Voice: Your brand’s market share of the conversation.
- Social Search Visibility: Ranking for keywords inside social apps.
3. Conversion & ROI
- Conversion Rate: The percentage of users who take action.
- Click-Through Rate (CTR): Your ability to move users off-platform.
- Cost Per Click (CPC): Efficiency of your ad spend.
- Cost Per Thousand Impressions (CPM): Cost-efficiency of visibility.
- Return on Ad Spend (ROAS): Direct revenue generated by ad investment.
4. Audience Health
- Follower Count: Baseline audience size.
- Follower Growth Rate: Momentum and content appeal.
- Sentiment: The emotional tone of mentions.
- Demographics: Behavioral and psychographic data for targeting.
5. Video & Service Performance
- View Count: Initial reach.
- Video Completion Rate: The percentage of viewers who finish your content.
- Watch Time: Total duration of engagement.
- Average Response Time: Your team’s speed in social customer service.
- Customer Satisfaction (CSAT): Direct feedback on service quality.
- Net Promoter Score (NPS): A predictor of customer loyalty and advocacy.
- Referral Traffic: The link between social activity and web outcomes.
Strategic Implications: Closing the Feedback Loop
Tracking these metrics is useless if they do not lead to action. To implement a data-driven strategy in 2026, follow this five-step feedback loop:
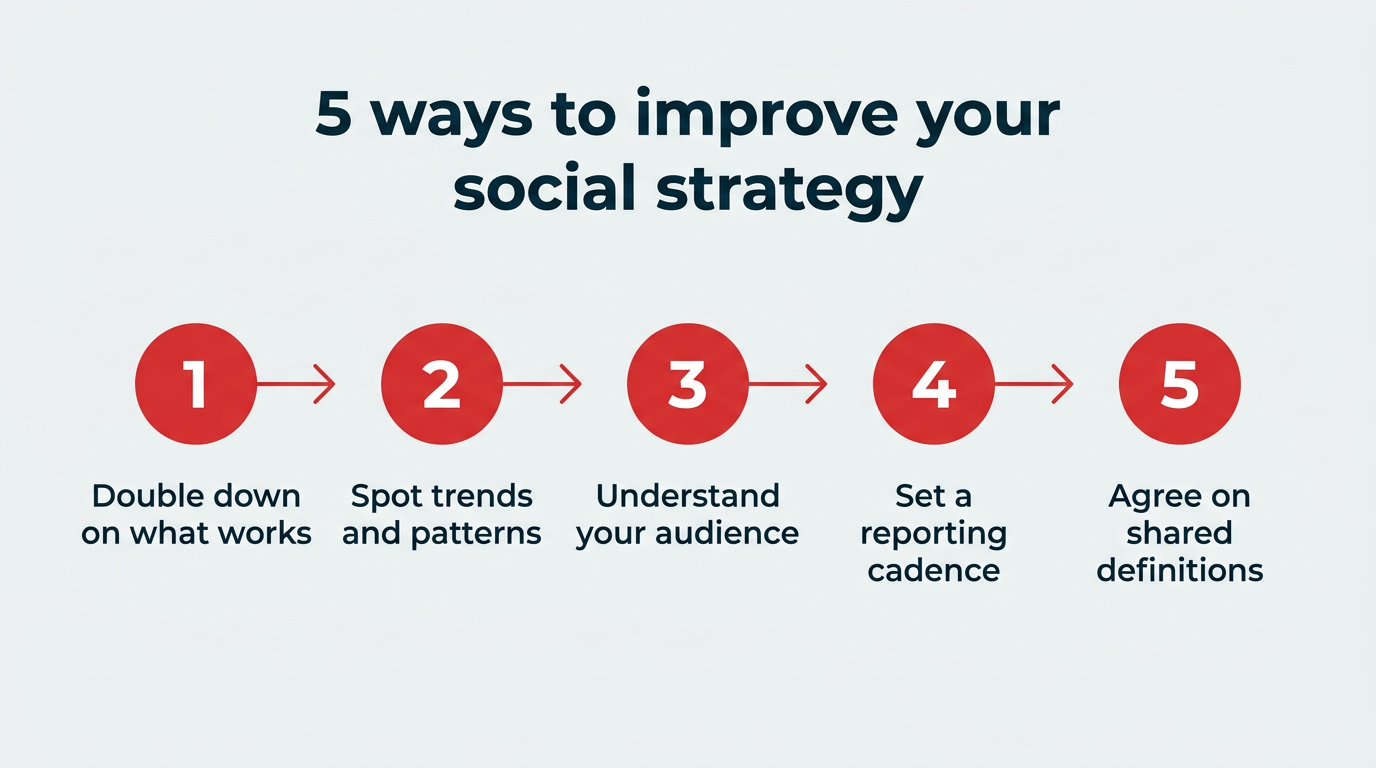
- Audit: Review your previous month’s metrics to identify top-performing content.
- Hypothesize: Based on that performance, decide what variables to test (e.g., video length, CTA placement, posting time).
- Execute: Run the content as planned.
- Measure: Use native analytics or unified tools like Hootsuite to collect the data.
- Pivot: Adjust your strategy for the next cycle.
The Role of Technology
As the volume of data grows, manual tracking becomes impossible. Enterprise teams should look toward unified dashboards like Perch by Hootsuite or consumer intelligence tools like Lumen by Talkwalker. These tools don’t just collect numbers; they provide the context needed to understand why a post succeeded or failed.
Conclusion: The Path Forward
In 2026, the brands that win will be those that view social media not as a broadcasting channel, but as a data-rich environment for customer engagement and business intelligence. By focusing on the 25 metrics outlined above, organizations can move past the superficial and build a sustainable, high-performing social strategy that contributes directly to the company’s bottom line.

Remember: What gets measured, gets managed. If you aren’t tracking your performance with precision, you are essentially flying blind in an increasingly competitive digital atmosphere. Start today by choosing the five metrics that most closely align with your current business goals, and build your reporting infrastructure from there.
 Reynand Wu
  Muslim
  Nila Kartika Wati